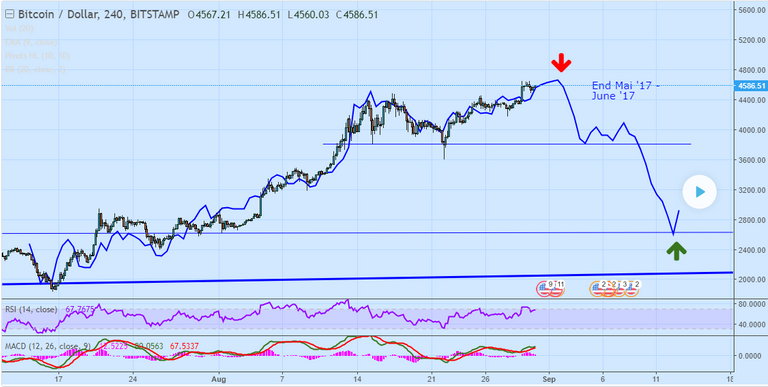
The blue line represents the BTC-chart from end of may to june. The current trend follows the old trend very closely, so keep an eye on it!
This chart is based on an older private idea I published two weeks ago. I link it for you down below.
Picture of end may - june:


Great post Thanks for the read brother