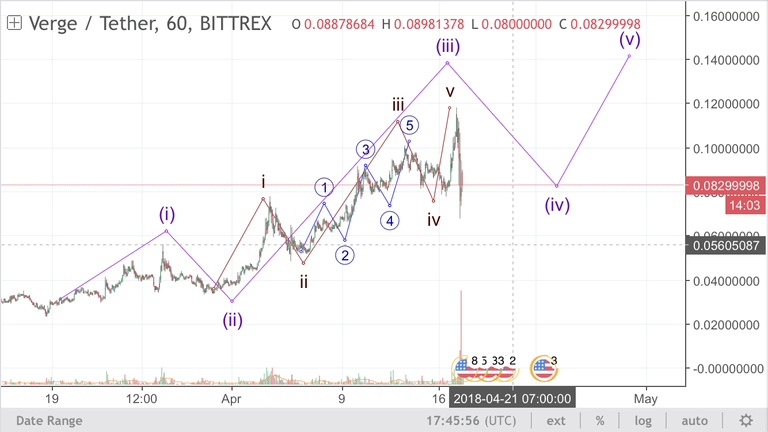
I cannot tell for sure which chart you posted, but is this is the $ chart, the bottom of white 4 overlaps with top of white 1. I have it a little different. Thoughts?

I cannot tell for sure which chart you posted, but is this is the $ chart, the bottom of white 4 overlaps with top of white 1. I have it a little different. Thoughts?

Your version is also possible. But if this correction goes any deeper (which it likely will in wave c) it hints at the completion of a wave 1 rather than 3.
It doesnt matter much. Only time will tell.
Thanks, I appreciate the feedback. As someone who is new to this, it is particularly helpful to get some insight into the reason you lean one way over another, so thanks again.