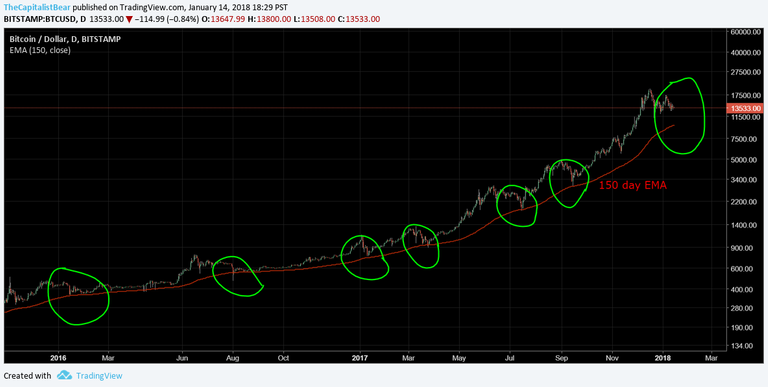
We've been tracking this larger wave correction in BTC since Dec.
As shown, BTC has respected the 150EMA like clockwork; retreating to it after 6 previous corrections in the past 1-2yr.
In trading this is called "reversion to the mean", and it's very common.

Due to the large run BTC had prior to Dec, it needs to revert to the mean before being able to rise again. This can occur via price, time or both.
The goal of the correction will be for the market to weed out the bulls and cause them frustration via losses, or inactivity. When they finally capitulate to bears, the market reverts as there are no new sellers left to drive down price.
Expect BTC to meet up with the 150EMA (daily chart), before POTENTIALLY running higher.
YES BRO you said it, also in a comment somewhere where I read this chart. What I especially liked is how you went against dominant sentiment.
This post deserves more credit. Upvoted, followed and resteemed.
SteemitRomney we're either a contrarian or a victim. :)
@bodaggin- great observation! Reversion to mean is a powerful thing for investing and looks just as applicable for cryptos.
Well, let's hope that BTC will "revert to the mean" in the same pattern as the first circle drawn on bottom left. This will give a multi-day consolidation side way without a drastic and sudden drop like the others circles - thus not shaking the market cap and disrupting the altcoins from having their next wave up.
As we know, any drastic BTC moves up or down will send the altcoins down. A long drawn BTC consolidation pattern will allow both scenarios; i.e. reversion to the mean and overall market cap increase with altcoins moving along the same. Nice post! BTW, I'm new to TA, hope what I said is a possibility TA-wise.
We are now at the "mean" of 150EMA now and testing this level... but seems like the next support line is further down to 8000-ish level.
Let's see if it can hold for the next couple of days :)