Key Points
Bitcoin cash price broke many supports and traded below $800 against the US Dollar.
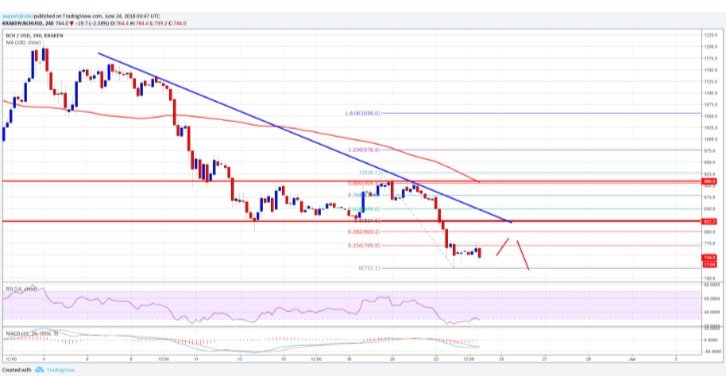
There is a crucial bearish trend line in place with resistance near $820 on the 4-hours chart of the BCH/USD pair (data feed from Kraken).
The pair is likely to continue its decline as long as it is below $850 and $900 resistance levels.
Bitcoin cash price declined heavily below $900 against the US Dollar. BCH/USD may perhaps accelerate declines towards the $700 level in the near term.
Bitcoin Cash Price Decline
This past week, there was a major bearish reaction from the $910 resistance zone in bitcoin cash price against the US Dollar. The price started a major downside move and dropped below the $850 and $800 support levels. The decline was such that the price even broke the $750 support zone. A low was formed near $721 and the price is now trading well below the 100 simple moving average (4-hours).
At the moment, the price is correcting higher and is trading near $740-750. The 23.6% Fib retracement level of the last decline from the $928 high to $721 low is acting as a resistance. On the upside, there are many hurdles for buyers around the $820 level. The stated level was a support earlier, and now it coincides with the 50% Fib retracement level of the last decline from the $928 high to $721 low. Moreover, there is a crucial bearish trend line in place with resistance near $820 on the 4-hours chart of the BCH/USD pair.

Looking at the chart, the price may face a lot of barriers near $820. On the downside, the recent low of $721 is a short-term support. A break below this could push the price towards the $700 handle.
Looking at the technical indicators:
4-hours MACD – The MACD for BCH/USD is slowly reducing its bearish slope.
4-hours RSI (Relative Strength Index) – The RSI for BTC/USD is now near the 30 level.
Major Support Level – $700
Major Resistance Level – $820
( Please up vote and comment )