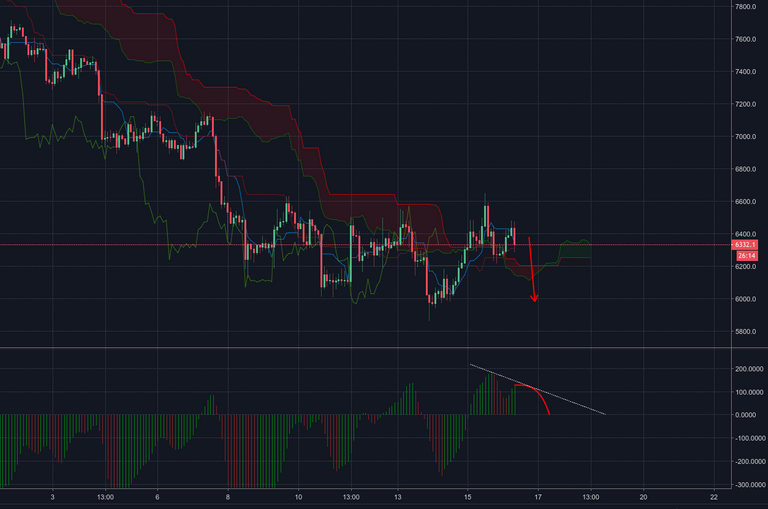
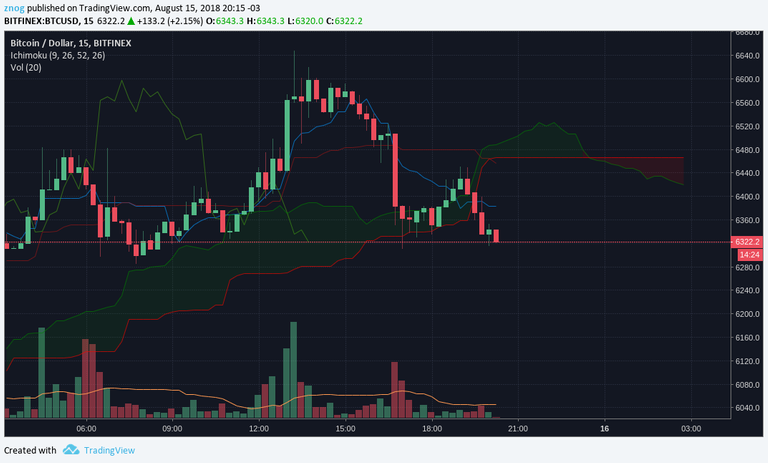
We had two days of going up, and it was the longer since the downtrend started (about 1k USD up), but although the Ichimoku cloud started showing some green, the chart is moving down over a red section. Hitting the cloud in this condition more often that not, results in going through it rather than bouncing. Should this happen, it would also form a "tween peak" on the AO, suggesting a trend shift (to the down direction... we are talking short term here).

Now, check this mycotoxin post, where he spotted a H&S if the price goes under 6230
https://www.tradingview.com/chart/BTCUSD/Kl3UrB51-BTC-H-S-Not-valid-if-it-does-not-move-lower-than-6230/
And I previously spotted this smaller H&S predicting ~6100 and this one already completed... so heading down looks very likely
And that fits @ew-and-patterns count:
https://steemit.com/btc/@ew-and-patterns/btc-update-15-08-18

Bitcoin started down fall maybe near 7 days !!!!
Strictly speaking, about two weeks ago: last high happened on July 28th. At least in the 2h scale, which is the one I use.