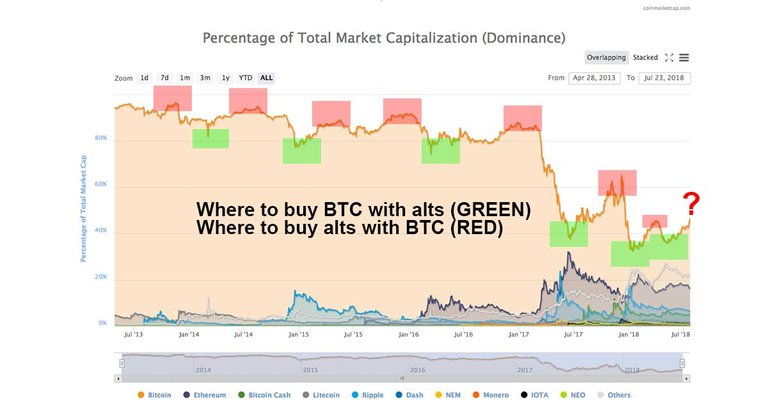
Bitcoin Dominance in the crypto market hit a 2018 high with 45%+ of the crypto market cap being Bitcoin. This occurred due to Bitcoin gaining value in anticipation of a Bitcoin ETF while alts lagged. Let’s discuss Bitcoin Dominance.
NOTE: In the chart above it shows where it would make sense to trade alts to BTC and vice versa based only on the crypto dominance chart. About half of those end up being bad or lukewarm plays at the time. I’m not trying to illustrate the best places to buy if you have a time machine, I’m trying to illustrate how patterns in Bitcoin dominance can inform your timing of swapping BTC and alts around. 😉
Here is everything you need to know:
Dominance refers to how much of the total market cap of crypto belongs to a given coin.
What coins do well goes in cycles and Bitcoin and alts have historic relationships that seem to play out again and again. In this cycle here in July 2018 Bitcoin is outpacing alts (leading to declines in BTC values for altcoins). NOTE: This stings a bit for alt investors because alts just tracked BTC during the last correction, but haven’t tracked BTC during this recovery (meaning many alts are in rough shape by 2018 standards)…. that said, we saw this in February as well to some extent.