
One of the biggest financial stories of 2017 has been the seemingly unstoppable rise of bitcoin, which has more than tripled this year and seems to make new records by the day.
Such a rally has inevitably raised questions over whether there is a bubble in the digital currency, or in the broader space of cryptocurrencies, which earlier this week topped $100 billion in combined market capitalization. Breaking that milestone was largely due to bitcoin BTCUSD+2.62% which by itself accounts for nearly half the value of the still-nascent sector. However, a new measure of bitcoin valuation, one based roughly on the price-to-earnings ratio applied to stock valuation, suggests that rally still has room to grow.
Gauging whether bitcoin is overvalued is tricky, as it is divorced from many of the standard attributes that can measure a security’s fundamentals. Unlike a stock, bitcoin has neither traditional revenue nor profits behind it, ruling out such equity statistics as price to sales or earnings before interest, tax, depreciation and amortization.
And because it isn’t backed by a central bank or government, viewing it in the way one might a currency isn’t an apples-to-apples comparison. A commodity like oil can be measured based on the principles of supply and demand; bitcoin has no equivalent underlying asset. (The Internal Revenue Service classifies bitcoin as property rather than a currency, while the U.S. Commodity Futures Trading Commission classifies it as a commodity.)
However, some analysts have developed what could be considered a price-to-earnings ratio for bitcoin, one that suggests the recent surge may not have taken it to bubble territory.
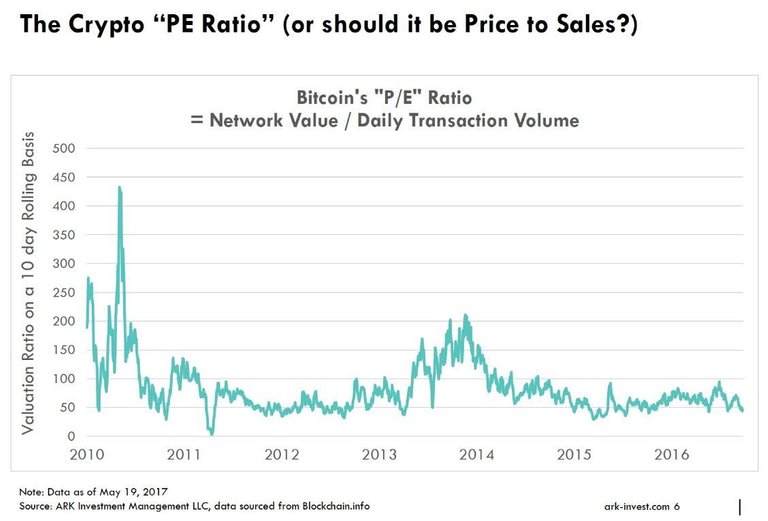
Bitcoin’s “P/E ratio” looks at the digital currency’s network value—the number of outstanding bitcoins multiplied by price; this figure is currently $44.69 billion—against its daily transaction volume.
“The reason I call it a P/E ratio is because when I think about what a P/E signifies for equities, it is basically the function of market cap and earnings. The earnings are the underlying utility—the cash flow of the company,” explained Chris Burniske, a blockchain analyst at ARK Invest, who has helped to develop this metric.
“Bitcoin P/E is composed of similar concepts. Instead of market cap, you have network value. That’s then divided by the underlying utility of bitcoin, which is its ability to move money. That’s bitcoin’s core utility, same as a company’s core utility is earnings.”
This metric currently gives bitcoin a ratio of roughly 50, which is under its long-term average and well below past peaks, which have been above 200, and one time spiked to nearly 450.

“On a stock, a P/E ratio of 50 would be pricey,” Burniske noted, “but I don’t know if it should be considered pricey for bitcoin. It looks to be in a comfortable range, it isn’t an outlier and right now the broad takeaway I have is that it doesn’t look like we’re due for a mean revision.”
He added that over time, cryptocurrencies would find a “base range” for valuation on this metric, “one that lets investors know what would be reasonable to pay based on the crypto’s daily utility.”
While high P/E ratios are often seen as sell signals for stocks, Burniske suggested that any kind of extreme reading on this metric could signal a bitcoin selloff.
“This ratio drops when bitcoin is in the late stages of rallies, because investors would take profits or move their money between exchanges out of nervousness. That leads to a lot of transaction value, which makes the denominator higher. That’s why it’s important to me, from a valuation standpoint, that it isn’t high or low.”
Hi! I am a robot. I just upvoted you! I found similar content that readers might be interested in:
http://www.morningstar.com/news/market-watch/TDJNMW_20170608636/update-is-bitcoin-in-a-bubble-this-metric-suggests-theres-more-room-to-grow.html