The most valuable coin had another encouraging week, as it emerged from a brief but violent correction, just to reach new highs towards the end of the week, draining capital from altcoins. The total value of the market is stagnating near the all-time high, but BTC crossed the $100 billion mark as it surged past the $6000 price level, controlling 58% of the market.
With the long-term MACD clearly being overbought, and as the long-term target has been hit, investors should now be looking for exit points, even as the short-term uptrend is intact. The range projection target of the recent correction is found at $7000, but correction risks are already high, and only small positions should be kept in the current setup.
Bitcoin
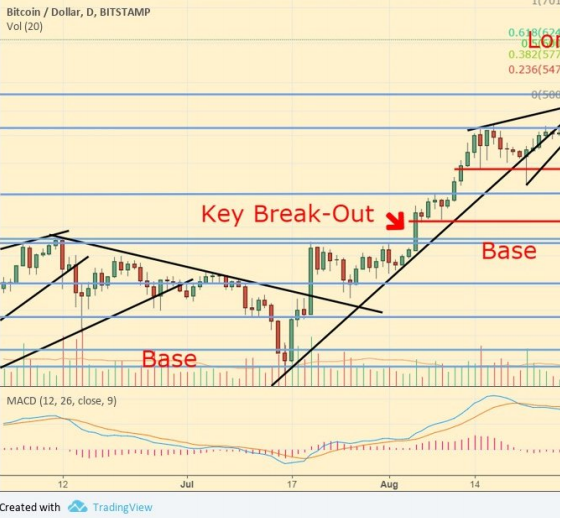
BTC/USD, Daily Chart Analysis
Most of the major altcoins are trading in narrow ranges this weekend after a slightly bearish week, as the optimism surrounding Ethereum’s major update faded and the second largest coin re-entered its previous range. Litecoin, Dash, and Monero are still looking encouraging despite the lengthy correction, while the recently, while the relatively weak Ethereum Classic IOTA continue to show worrying signs. As the Bitcoin long trade is getting stretched, let’s see the how the daily charts of the altcoins are shaping up
Ethereum
ETH/USD, Daily Chart Analysis
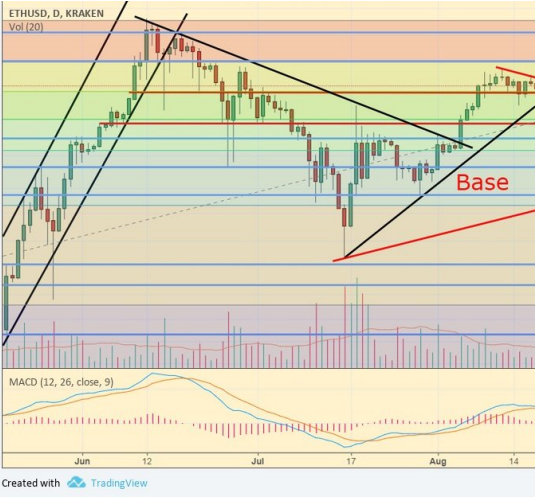
Ethereum reversed its pre-Byzantium gains and dipped briefly below $300 amid the early-week correction but it recovered to the prior trading range, and remains bullish regarding the long-term picture. We still expect the coin to test the $380 level in the coming weeks, and only a break below the rising trendline would change the longterm setup. Support is still found at $300, $285, and $250 while resistance is ahead between $330 and $350
Litecoin
LTC/USD, Daily Chart Analysis
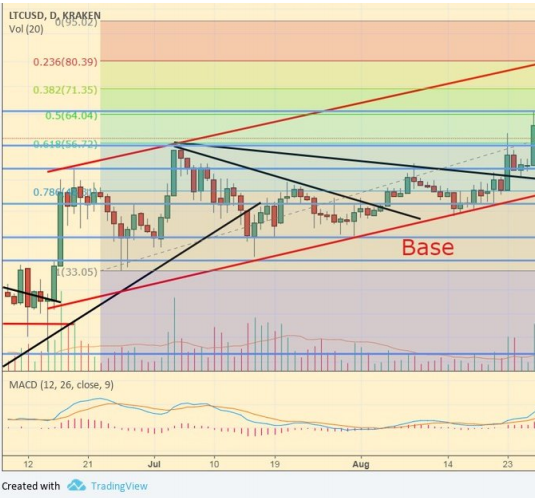
Litecoin also fell sharply during the dip, and it is back below the previous trend channel, despite showing relative strength during the rebound. The coin still faces strong resistance near $64, but we expect the long-term rising trend to prevail, although more sideways price action is possible before a move towards the all-time high, especially if BTC enters a correction soon. Crucial support levels are still found at $56, $51, and near the $44 level.
Ripple
XRP/USDT, Daily Chart Analysis
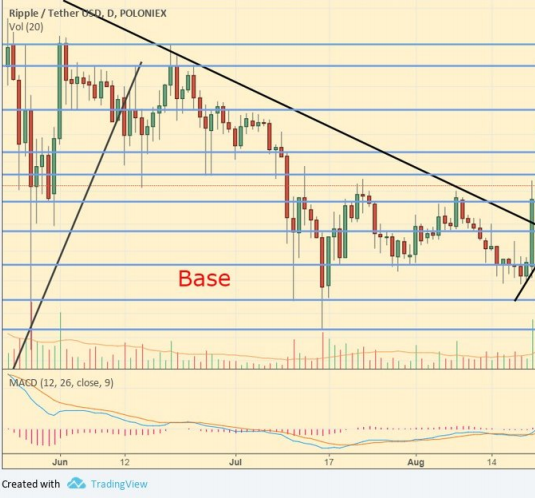
Ripple had a very volatile week after the break-out attempt that tested our primary target at $0.30, but failed at the crucial level. The coin fell all the way back to the initial break-out level after exiting the short-term trend, and although the long-term setup is still bullish, more volatile consolidation is now likely. Support levels are found just below the $0.20 level, near $0.18 and $0.16, while resistance is ahead around $0.22 and $0.26.
Dash
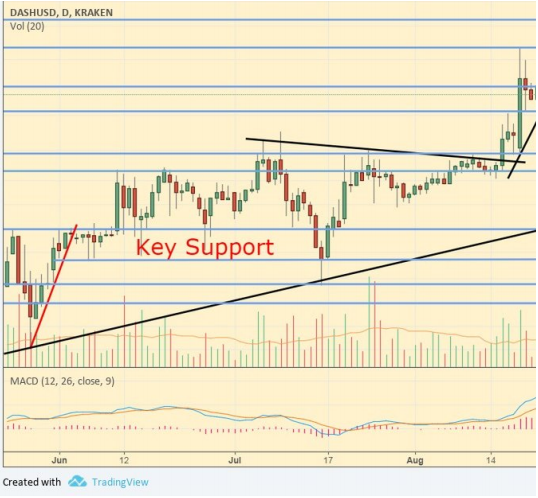
DASH/USD, Daily Chart Analysis
Dash remained very calm amid the volatile moves in the segment and it continues to trade in the correction pattern that developed after the August rally. The coin is well inside the long-term uptrend and we expect the advance to resume with no durable move below the current range, but the short-term picture is still only neutral. Longterm support is found at 4265, while key resistance is ahead at $360 and near $400.
Ethereum Classic
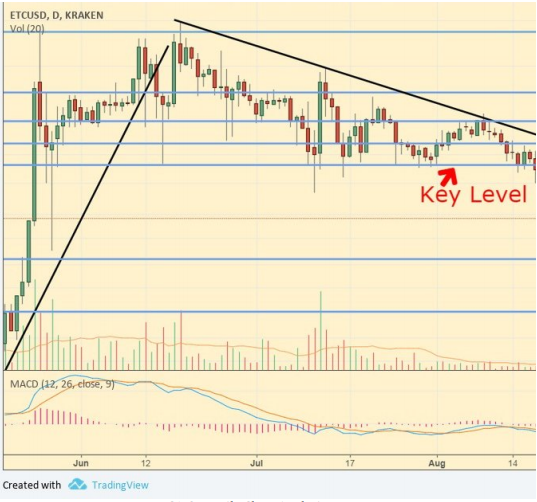
ETC/USD, Daily Chart Analysis
Ethereum Classic is trading below the $11 level again after struggling throughout the week, and failing to move above short-term resistance at $12.50. The coin is far from a short-term buy signal, as it is stuck in a downtrend, but the long-term picture is not decisively bearish, and a recovery is likely, with the current price levels still being attractive for investors. Crucial support is found at $9, while resistance is ahead around $13.50 and $16.
Monero
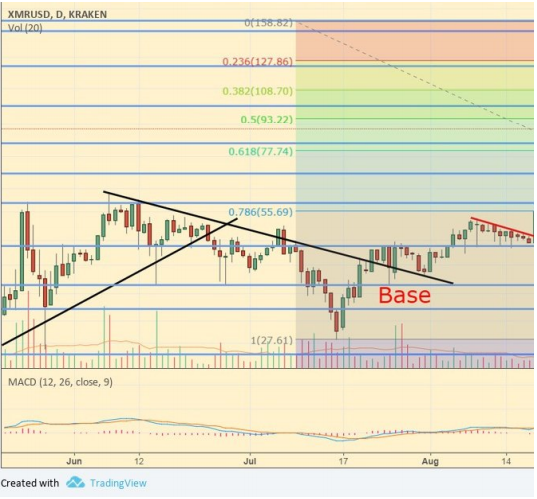
XMR/USD, Daily Chart Analysis
Monero has been closely correlated in recent days with Dash once again, although it outperformed its closest peer last week. The coin is trading in a very narrow range between the strong levels near $80 and $100, with the long-term picture still being very positive for investors. We still expect a strong leg higher following the consolidation, with targets at $100, $125, and around $150 and support below $80 near the $68 level.
IOTA
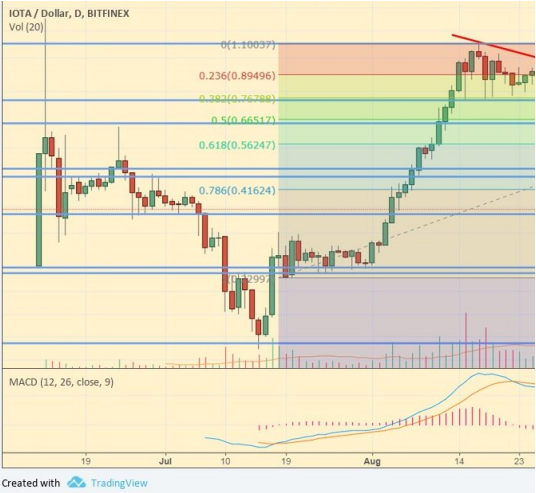
IOTA/USD, Daily Chart Analysis
IOTA remained under surprisingly strong selling pressure throughout the week, and contrary to our expectations it failed to recover above the $0.45 level, as the shortterm downtrend is still intact. The coin is currently testing the key $0.35 level, and a move below that would warn of further weakness, although the long-term picture is still encouraging for now. Above the $0.45-$0.48 zone, further targets are ahead at $0.56 and $0.64.
How to Use These Charts?
As we stressed in our article on Bitcoin: “…not all strategies are binary (either holding an asset or not).There are many long- and short-term investment and trading strategies that can be successful in a roaring bull market like the one that the crypto-coin segment is experiencing, but mixing the time-frames and mixing trading and investing (see our article on the topic) could lead to troubles.”
Here is a reminder of some of the possible strategies once again:
- Buy and hold, without caring about day-to-day (or even month-month) fluctuations
- Buy and hold a core position and add on the major dips; a very powerful strategy
- Buy a certain amount every week or month, and even-out your entry price, without the hassle of timing the market
- Try to catch major turning points to reduce and “re-boost” your position
- Trade short-term movements with stop-losses, targets, and strict risk management (this is trading not investing)”
Hi! I am a robot. I just upvoted you! I found similar content that readers might be interested in:
https://hacked.com/long-term-cryptocurrency-analysis-bitcoin-outshines-altcoins/
your all post always good thank you sir.