I was inspired to set up my own small cryptocurrency index fund by the post https://steemit.com/bitcoin/@cryptoeagle/what-percentage-should-you-invest-in-each-cryptocurrency-to-become-a-multi-millionaire-a-winning-index-strategy-updated-8-24 by @cryptoeagle. However I found it difficult to keep track of how my index fund was doing so I setup a Google spreadsheet to track it.
It updates automatically everyday and gives me a quick snapshot of how I am doing.
In this tutorial I will show you how to create your own Google spreadsheet to keep track all of all of your cryptocurrency holdings and to see how your portfolio is doing over time. If you don’t want to set it all up from scratch you can use the one I made for this tutorial as a template.
You can find the sample sheet here:
https://docs.google.com/spreadsheets/d/1gKLzT5LVJ2tKUufV-de8KjBXFRpYrtA45ahucz03hTA/edit?usp=sharing
To edit it click File -> Make a Copy…
This will save a copy of the spreadsheet to your drive that you can edit.
Tutorial
Step 1Go to your Google drive and create a new Google spreadsheet. Name it what you want, I’m using Portfolio Performance
Step 2
Go to the Script Editor under Tools. This should open up the script editor in a new tab.

Step 3
Give your code a name and delete the four lines of code that are provided by default.

Step 4
From Github copy and paste this code into the script editor.
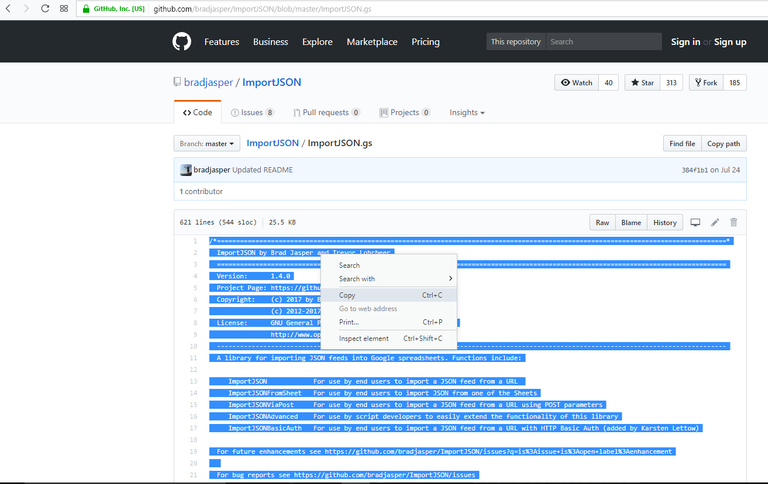
Step 5
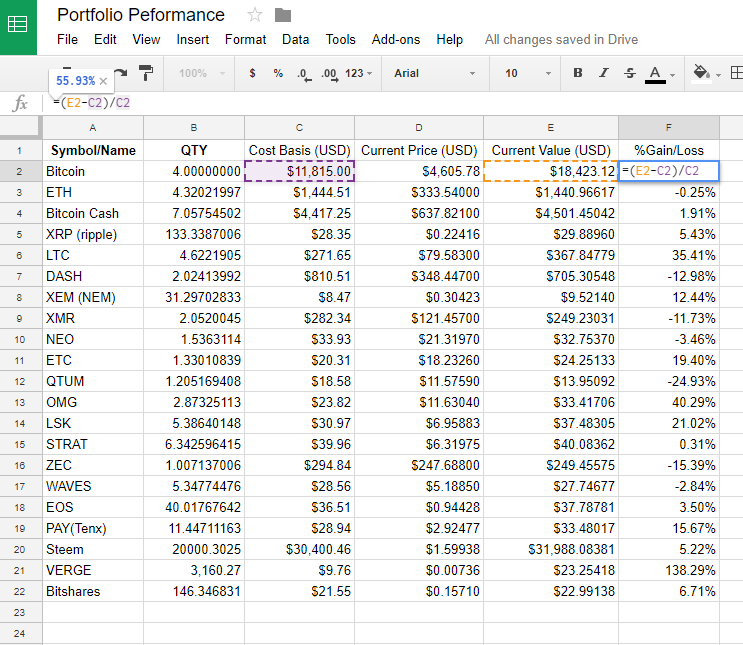
Go back to the Coin Holding Performance sheet and build a table like the one shown below with all of the crypto curriences you hold.
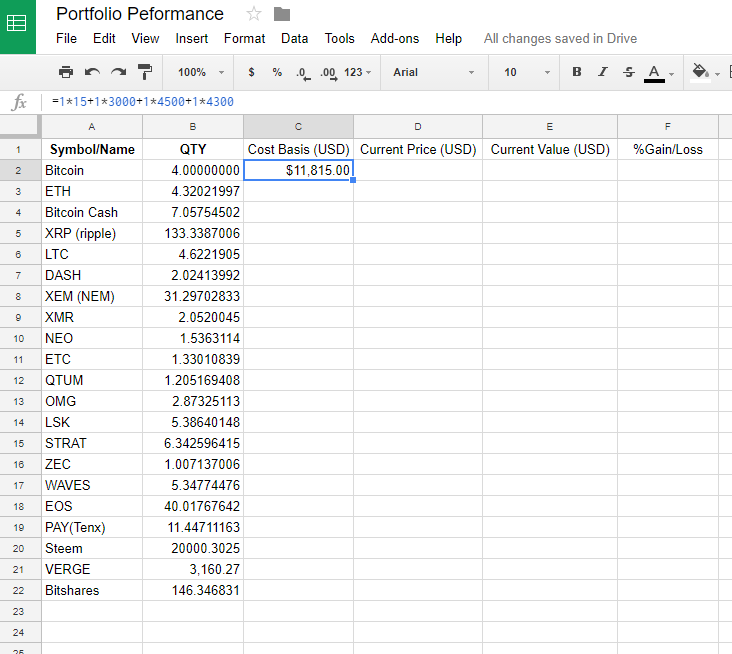
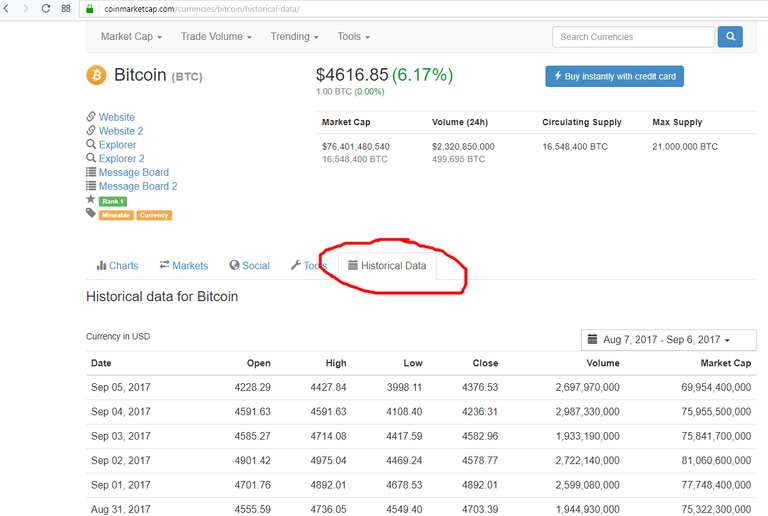
Place the name or symbol of each currency in column A and the quantity in column B. Column C is how much you paid for the current quantity or your cost basis. If you didn’t buy it all at once you will need break it up into chunks to calculate your cost basis. In the example shown the portfolio has 4 Bitcoins, 1 was purchased at $15, 1 at $3000, 1 at $4500, and 1 at $4300. If you don’t know the exact amount you paid you can use the historical data table on coinmarketcap.com to get close. (All of the numbers used here are made up for the purpose of this tutorial)
Step 6
In Column D we are going to put the current USD value the currency is trading at. This is where our Import JSON script will pull the current price from coinmarketcap and pop the value into our sheet. Paste this formula into cell D2 to get the current price of bitcoin in USD.
=ImportJSON( "https://api.coinmarketcap.com/v1/ticker/bitcoin/?convert=USD","/price_usd","noHeaders")
This formula can be changed to get the current price of any currency currently listed on coinmarketcap. For Ethereum it looks like this:
=ImportJSON( "https://api.coinmarketcap.com/v1/ticker/Ethereum/?convert=USD","/price_usd","noHeaders")
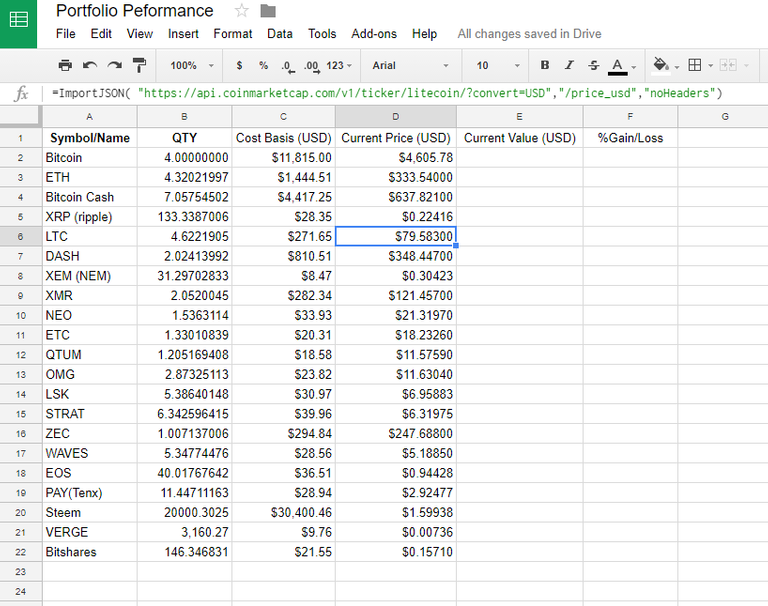
Calculating column E is simply a matter of multiplying column D by column B.
The percent gained or lost is then calculated by subtracting the costs basis (C) from the current value (D) and dividing the result by the cost basis (C).
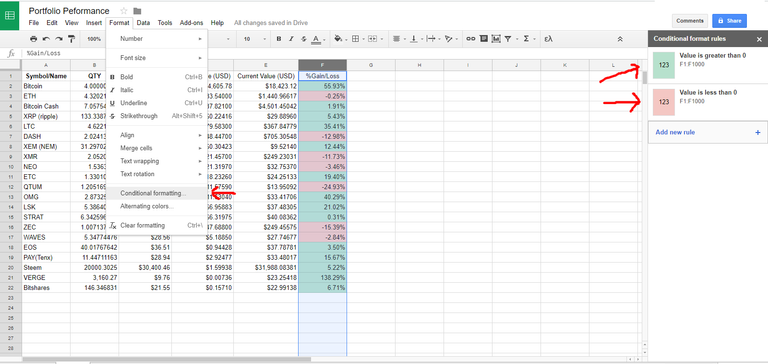
We can add some conditional formating to help us quickly see the gains and losses. Select column F and then click Format>Conditional Formating.
Setup two rules. One if the value is greater than zero color it green, and one if the value is less than zero color is red.
Step 7
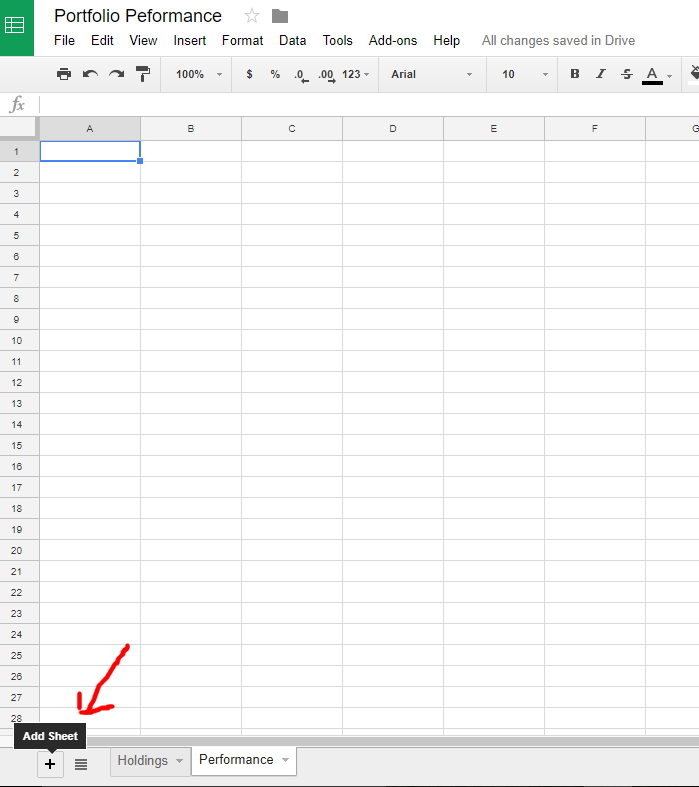
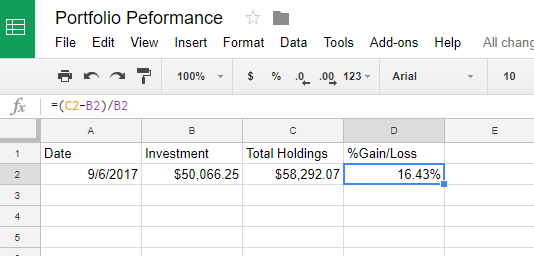
Now we can easily see how each individual holding is performing, but how about the whole portfolio? To see this we need to create a new sheet by clicking the little plus sign at the bottom left corner of the screen. Name this new sheet ‘Performance’.
Step 8
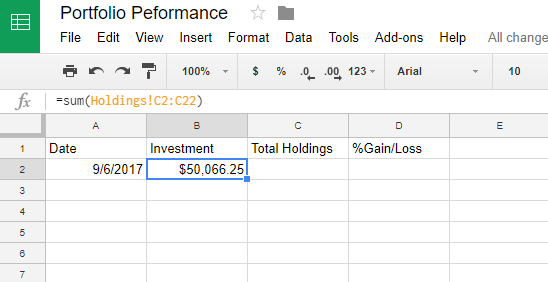
Setup a table like the one below.
Step 9
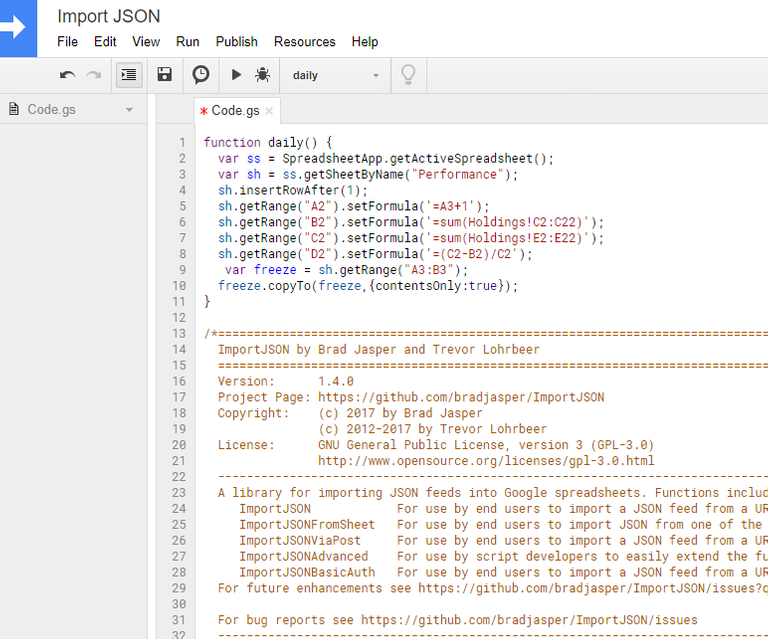
This is all well and good, but if we wanted to see how our portfolio was performing over time we would have to come into the sheet periodically and add another row. What we are going to do is set that up to happen automatically. Go back to the script editor. If it is not still open in a different tab use Tools>Script Editor.
Copy this code into the top of the editor:
function daily() {
var ss = SpreadsheetApp.getActiveSpreadsheet();
var sh = ss.getSheetByName("Performance");
sh.insertRowAfter(1);
sh.getRange("A2").setFormula('=A3+1');
sh.getRange("B2").setFormula('=sum(Holdings!C2:C22)');
sh.getRange("C2").setFormula('=sum(Holdings!E2:E22)');
sh.getRange("D2").setFormula('=(C2-B2)/C2');
var freeze = sh.getRange("A3:B3");
freeze.copyTo(freeze,{contentsOnly:true});
}
Step 10
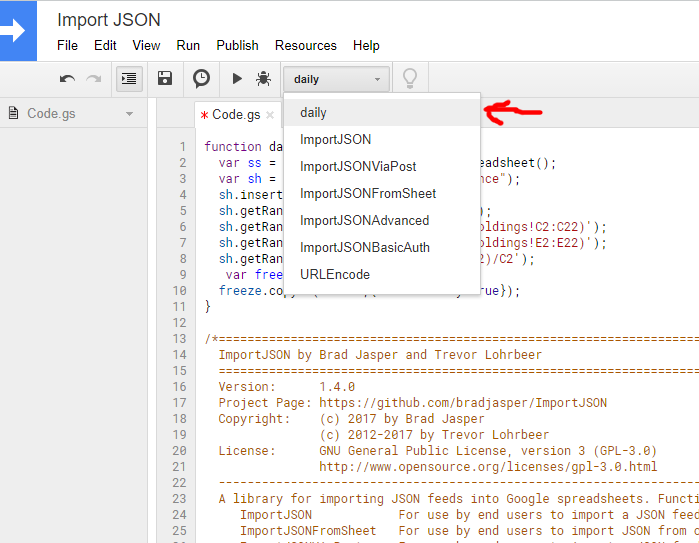
For this script to work you must have setup the sheets as I have shown or else it may use the wrong values. To test if everything is working correctly. Save your script and then click ‘Select Function’ and select ‘daily’.
Then click the little ‘Run’ triangle.
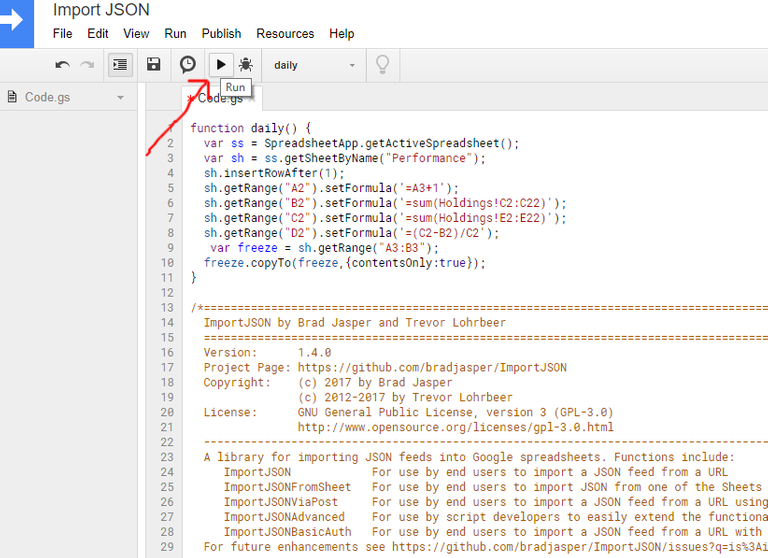
You will probably get a security warning. Allow Import JSON the permissions it needs and then it will run. Now go back to the ‘Peformance’ sheet and if you see a new line added that has tomorrows date on it then it worked!
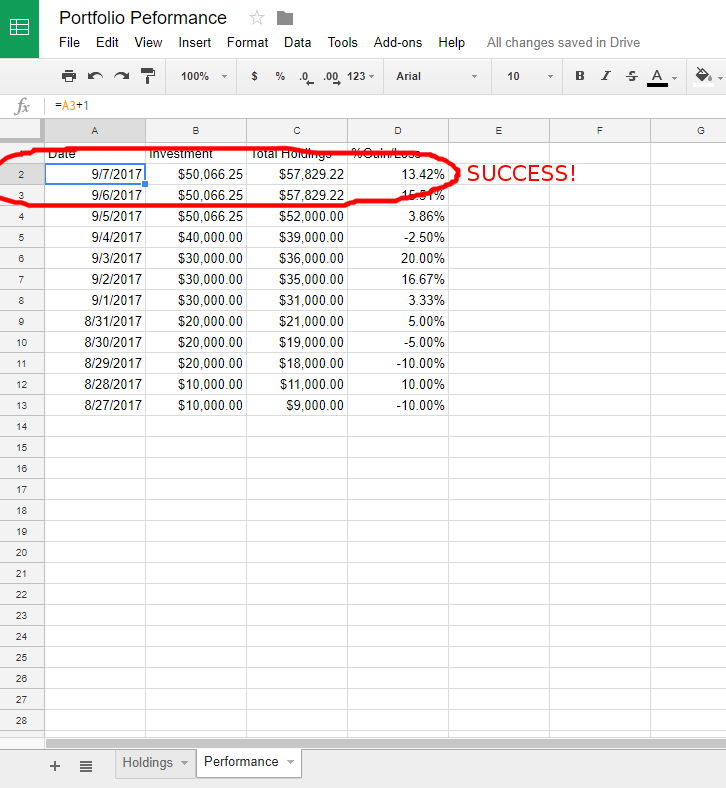
Step 11
We know it is working so you can delete the new row it added. Now go back to the script editor. We are going to set the ‘Daily’ script to run daily. Click on the little clock in a bubble symbol to open the triggers menu.
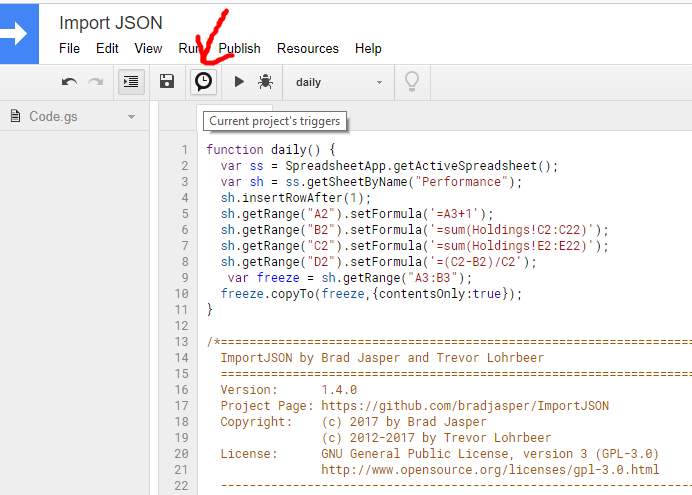
Then click on ‘click here to add a new one’
Set the options up to look like they are in the image below.
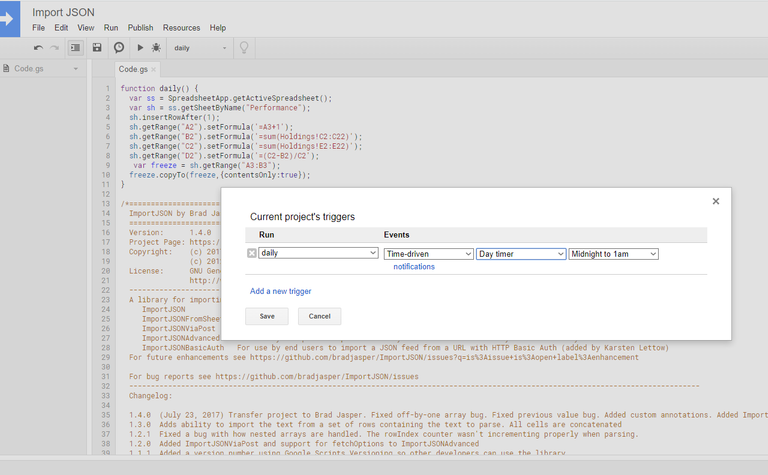
I set the script to run at midnight, but you can set it to whenever you like. Click save and you are done. Now everyday the script will run and track your portfolios progress.
Step 12
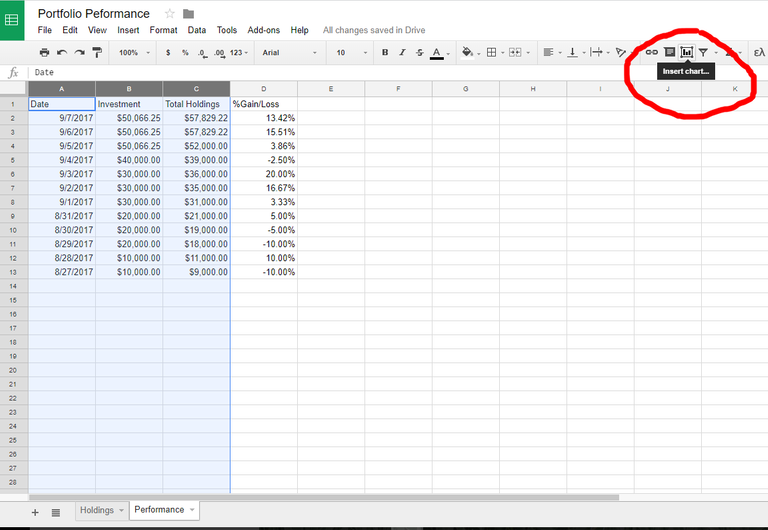
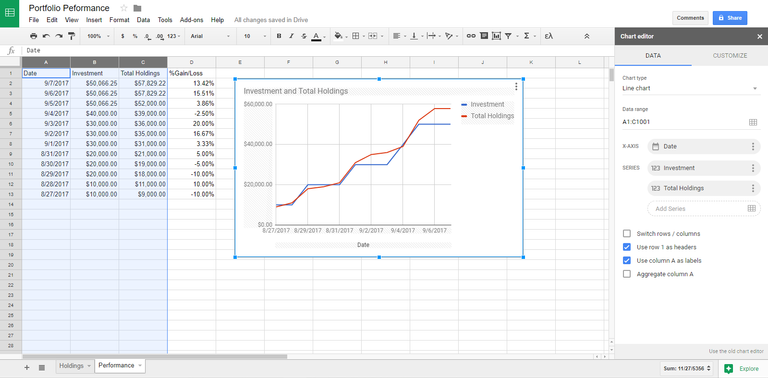
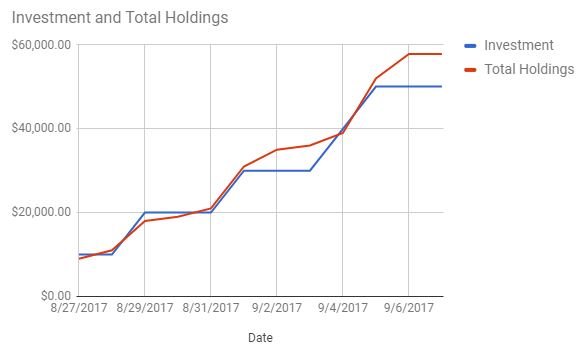
You can then add a nifty chart by selecting columns A through C and clicking ‘insert chart’.
Step 13
Watch your portfolio grow.
Step 14
If you found this tutorial useful please:
UpVote
Comment
ReSteem
Follow
Comment
ReSteem
Follow
Seems like great work but why not use the portfolio feature on cryptocompare.com?
Gives you excellent stats and the system tracks it all automatically for you. Only thing you need to do is input what cryptos you have, when you bought them and for what price.
Never heard of it. Looks interesting. I guess this is just another option for those that want more control or to run their own calculations and metrics.
Well if hadn't come across cryptocompare.com with its portfolio feature myself I would have probably used your method!
But I'm all set with cryptocompare. It actually takes the prices from several major exchanges to calculate it all and it works excellent on your mobile phone as well. I recommend it to everyone.
Solid post! Tons of information. I'm more than happy to have upvoted.
Thanks for the detailed post. But I find this too much of work and difficult to spot any errors. Why not use Cointracking Portfolio Manager.
It has
I have been using it for three months. It does what you are trying to achieve and much more.
Looks like a nice service.
Congratulations @treebuilder! You have completed some achievement on Steemit and have been rewarded with new badge(s) :
Click on any badge to view your own Board of Honor on SteemitBoard.
For more information about SteemitBoard, click here
If you no longer want to receive notifications, reply to this comment with the word
STOP@treebuilder got you a $1.51 @minnowbooster upgoat, nice! (Image: pixabay.com)
Want a boost? Click here to read more!
This post has received a 0.66 % upvote from @booster thanks to: @treebuilder.
This post has received a Bellyrub and 4.65 % upvote from @bellyrub thanks to: @treebuilder. Send SBD to @bellyrub with a post link in the memo field to bid on the next vote, every 2.4 hours. Be sure to vote for my Pops, @zeartul, as Steem Witness Hope you enjoyed your bellyrub!
Congratulations @treebuilder! You have completed some achievement on Steemit and have been rewarded with new badge(s) :
Click on any badge to view your own Board of Honor on SteemitBoard.
For more information about SteemitBoard, click here
If you no longer want to receive notifications, reply to this comment with the word
STOP