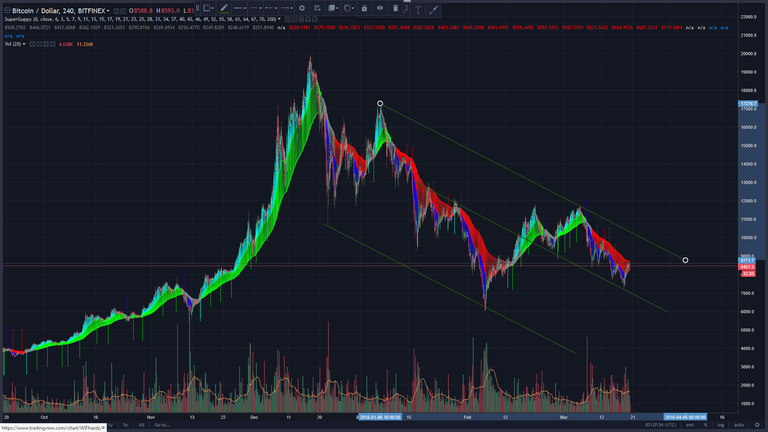
The last sunny days in Bitcoin is a vitamine boost for tired HODLers.We also had some sunny days at home. But as a north atlantic winter, I don't think the correction is over yet.

The Superguppy in the 4 hour chart here combined with the volume make me think this upswing is more of a temporary boost. It may hit the upper channel line wich act as resistance, but turn there. This give an upside to $9500 area.
The middle parallel line will act as support and the swing low line is also parallel.
The 1 hour chart show a bullish Superguppy, but the green investors group are still wide, and the gray traders group went from bull aqua to an indecisive grey.

The bump up show one Trend Break Arrow Alert and two green Swing Arrow Alerts, a bullish signal.
Candle patterns are quite indecisive, alternating bull and bear doji's in the turns.
Volume is decreasing.
The daily chart with TD Sequentials and Ichimoku cloud.

Trading below the red Ichimoku says we are still in bear territory.
TD count 3 green, I would not be surprised if we find a 8 or 9 at the top trend channel, at ~$9,660. If so we will have an exciting weekend.
These are just my thoughts, not a trading advice.
If you have another view on this post your welcome to discuss and post your charts in the comments.
If you'd like my technical analysis on another coin, please ask in the comments.

Comments are highly appreciated, and please
upvote, resteem and follow me if you profit or otherwise enjoy my posts !
Support me using these services
Also check out these other posts:
thank you
Your welcome :)
Resteemed by @resteembot! Good Luck!
Curious? Read @resteembot's introduction post
Check out the great posts I already resteemed.
ResteemBot's Maker is Looking for Work
Your analysis is similar to my expectations on bitcoin price. I think it is quite possible we go lower after we hit the 9K area. But if we breach the 9K decisively, we are probably in wave 3 and this will mean a new bull cycle has just started. Just my 2 cents :)
Yes we are in wave 3 unless we get a lower low, then this is just a continuation of wave 2 in Elliot terms.
I'll try to keep a chart with the main wave on hereafter :)
I think the blue line can give good support but breaking the green would give another lower low.
Going out of the green top line and we'll moon.
📲 Actual price was $8468-8475 at the actual exchange.. At the moment of posting.
@ipostbtcprice = @ipostwrongbtcprice