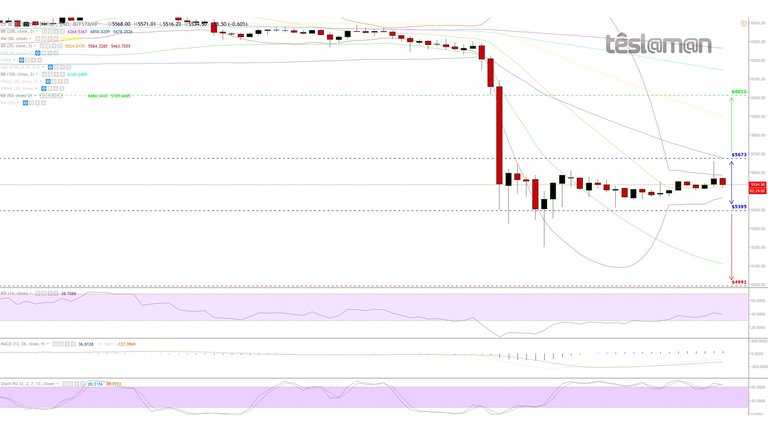
4H Chart - Price Key Points:
. 11/11/18 : 36hrs of consolidation.
. 14/11/18 : Reversal point at approx $6279.
. 14/11/18 : Second leg down at approx $6207.
. 14/11/18 : Waterfall effect at approx $6058.
Current :
. 4 days within narrow movement.
. Average support at approx $5503.
. Average resistance at approx $5575.
. Indicators render positive signals.
. 20MA Bollinger bands extremely narrow.
. Models hint to a possible minor buying attempt.

Possible Scenarios:
Long: On a confirmed break above $5673 – Price Target $6012 | Probability: 33% | Signal Strength: 2/5
Neutral: Price Range $5395 - $5673
Short: On a confirmed break below $5395 – Price Target $4991 | Probability: 40% | Signal Strength: 5/5
Our Stance: Minor speculative long.