I'm hesitant to write this post because it is quite a nuanced piece of price structure that helps experienced supply and demand traders take their trading one step further.
In terms of being able to spot areas of big imbalances in supply and demand, or even just where big buying or selling pressure takes place, failing to return (FTR) is one of the most important pieces of the puzzle.
Traditional supply and demand traders get caught out a lot by trading only one type of area, because as we've seen on the Bitcoin/Dollar chart recently, zones can get eaten up quite easily:
We all know what happened next!
Let's get to FTRs.
There are 2 scenarios that can happen when price reaches a barrier: it can break through it or it can be rejected by it.
When price breaks the barrier, we have 2 further scenarios that can occur:
1 - price can return above/below the barrier and continue against the direction of the break (i.e. a bounce)
2 - price can fail to return (to the S/D zone it came from) and continue in the direction of the break
In this second scenario, an FTR is always formed, and as already mentioned, is extremely important. Why? Because there is such strong buying/selling pressure at the FTR that price must continue in the direction of the break.
If buying/selling pressure remains at the FTR (unfilled orders), what's the likely result when we revisit that area?
Now to look at FTRs with ultra professional imagery:
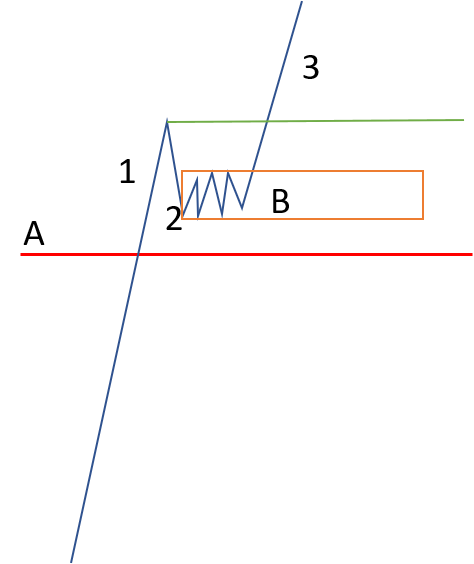
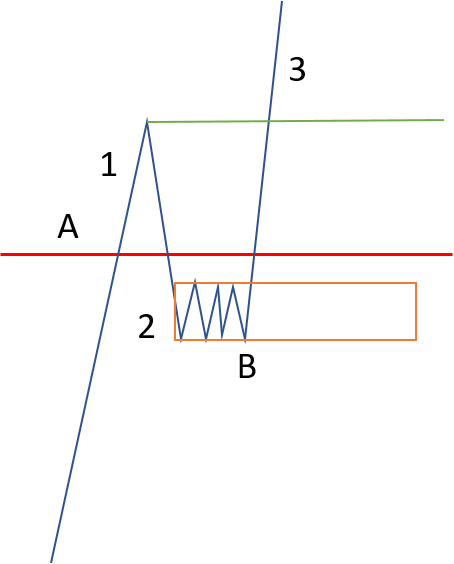
The red line (A) is a barrier which can be several things such as a support/resistance line, supply/demand zone, or even an FTR in the opposite direction.
1 - we break the barrier
2 - price retraces and forms a base/flag
3 - price breaks the high which formed after the break, confirming 2 as an FTR
Here's one in the opposite direction:
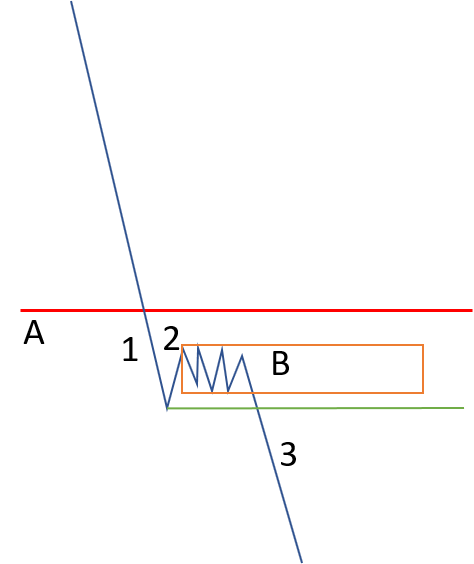
FTRs after the break of support or resistance are pretty common and thus should be easy for you to find. The real weight to an FTR comes from breaking a major level - the more important that level is, the more important the FTR is.
FTRs are also a great way to determine if we have got a fakeout of a level or a genuine break.
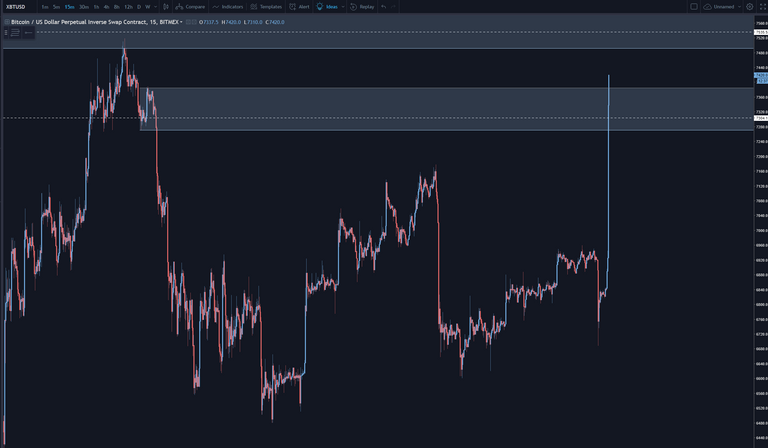
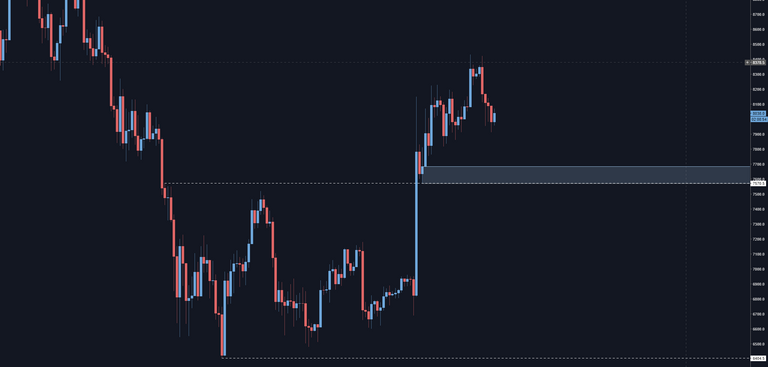
Here's an example on the current BTCUSD chart which I feel has quite a lot of weight to it:
We broke an important supply zone (unmarked to avoid confusion) with an 8H resistance line running through it.
The FTR was formed with the base of the zone being a bounce from that resistance line turned to support (SR flip).
It is certainly an area I'll be looking at when price returns there.
FTRs generally are amazing places to take trades from when they are revisited for the first time.
You can follow me on Twitter: https://twitter.com/technical_anal
This is legit. I'm a fan of all your posts.
I'll second that. You know this info is wasted on crypto investors ? Because they never sell and take profit like normal people, they just hold and hold and hold, even if the price drops 90%. The best they'll get out of this is possible entries.
She's right you know. Once I sink my teeth into a crypto it's game over
Haha, I feel like this type of information is wasted on a lot of people! I interact with quite a few day traders on my Twitter and I think they find it useful
do you mean real traders or just crypto traders ? lolol
Awesome, thanks x explaining!!