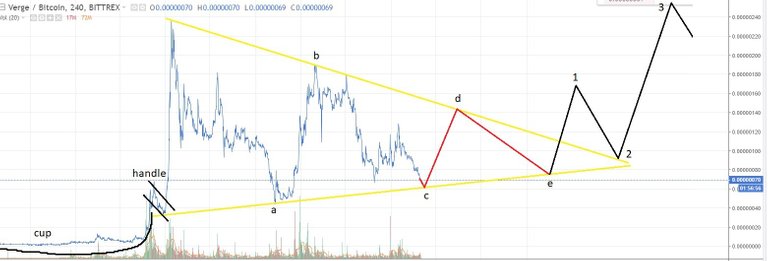
Kind request for refresh of XVG-USD and XVG-BTC. Price either broke down from the symmetrical triangle from Your post or... if we draw the triangle a bit differently - it can be still in it, nearing resistance.
I will have my books soon, but I tried to draw what I think. It's 99% based on Your XVG-BTC chart, only with a bit different triangle and different positioning of wave C.
I think recent price actions show that wave C wasn't complete on 20th of October, but it's close to completing now.
It may bottom at around 62 satoshis and start wave d (to around 143 satoshis).
How does it look Haejin?

Perfect.