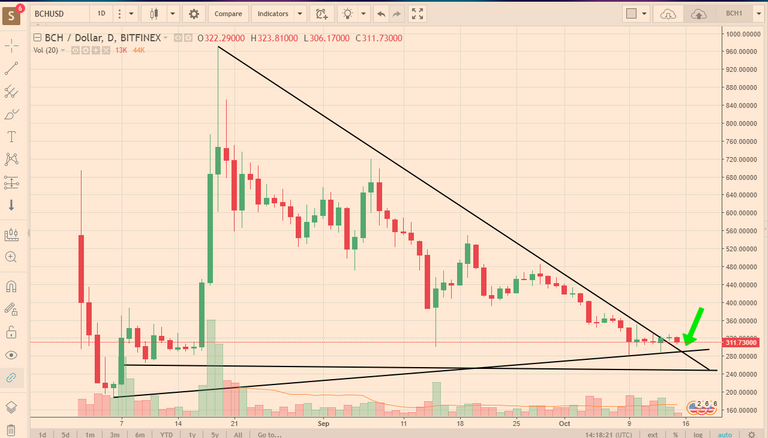
It looks like BCH has broken out of the top of the descending right triangle, a bullish move, right. Does the top resistance line now become the support? Or is one of the bottom lines more reliable as a support line? Not sure why I put the green arrow in there?!? My first time marking a chart, got carried away...
Anyhow, thanks for looking!
You are viewing a single comment's thread from:

Yes, as the prices are now going more lateral (purple lines) and not down, it's basing a bottom. Let's see what happens. If the ascending triangle pattern plays out, then higher highs are due.
