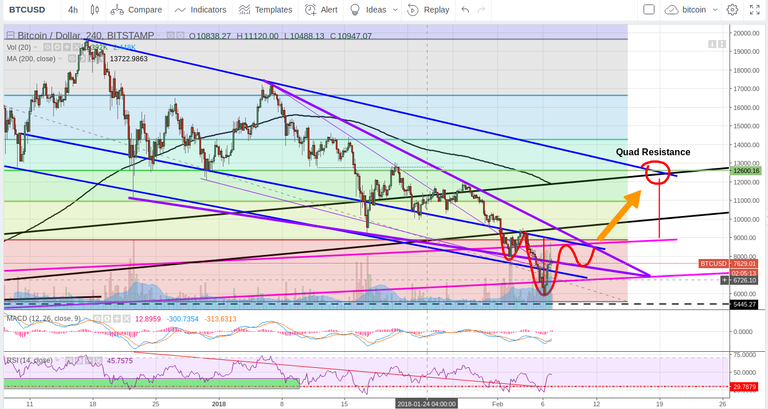
Here's what ole' BTC is currently looking like:
We've broken down out of our descending wedge and down out of our descending channel, capitulated, and have now move back up into both.
On the daily, we are attempting to swim above our 200MA.
It appears we are wanting to form an inverse Head-and-Shoulders pattern on the 4 hour. Volume has confirmed the left shoulder and head thus far. Right shoulder remains to be formed before this pattern can be confirmed. If it plays out as expected, that second to the bottom BLUE downtrend line would form a nice neckline. The upside target then would be EXACTLY the top of the BLUE channel. Time would put us right at the intersect of this downtrend channel as well as the top BLACK uptrend line. Price would put us right at .5 FIB level. All three intersect right at the end of our inverse head-and-shoulders exhaustion target. This would form MAJOR MAJOR quad resistance, likely ensuring another strong move down.
Short term I am long.
Once we reach the top of our BLUE descending channel, I will like sell some of my position (if not most) to see what the market decides.
Should we move up and out of our long time downtrending BLUE channel, my long term target this year is 50-80k.
Should we hit our heads and move down, I will probably buy back around 8-11k and HODL.
We'll see how this one plays out.
Best of luck traders!
Wonderful analysis
I've added the bitcoin I hold.
Good luck
Good luck to you sir. And thank you for the comment!
I hoping that it will come back up.
It will. But we may never see anything like we saw in 2017. HODL.