Suhdudes
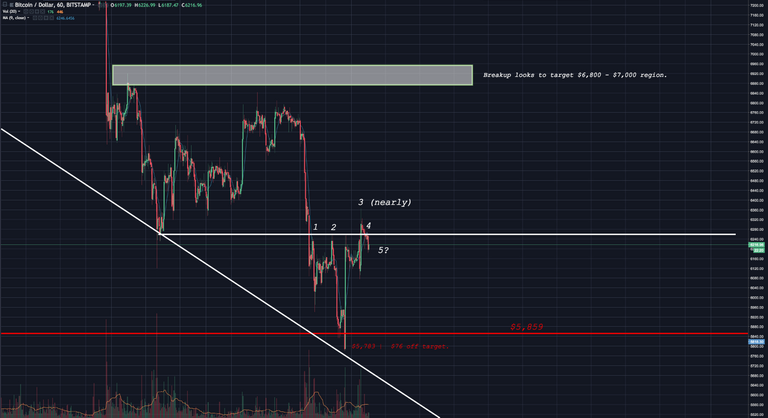
#BTC been testing some resistances around the $6,250 region.
Currently it has hit 4 times, piercing once showing the resistance weakening.
A break of this resistance upwards although unlikely without volume, looks to target $6,800 - $7,000 regions.
We broke downwards since last post, getting as low as $5,783, $76 off my target of $5,859.
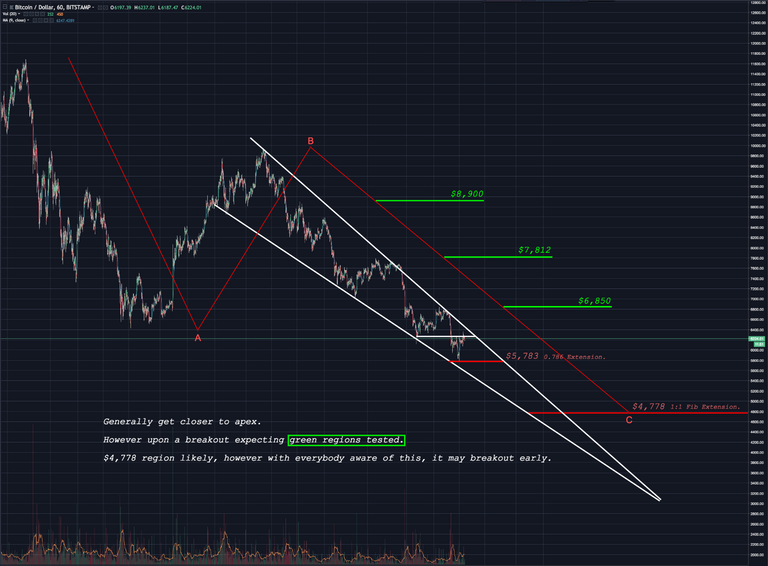
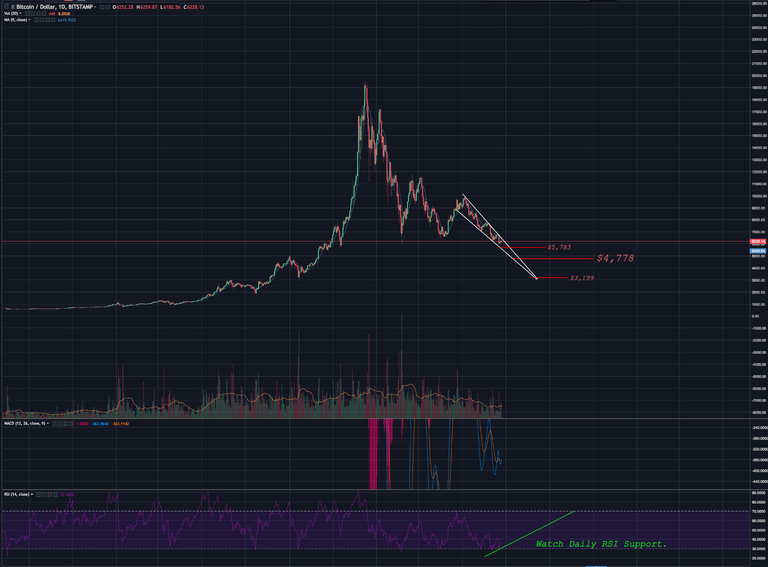
It is more likely we will continue this downtrend towards the long term target of $4,778.
This working nicely within the descending triangle, but i would tread carefully. As everybody wants #BTC at that region, it could also prematurely breakout of the triangle depicted in the charts below.
This is bargain price considering several targets mentioned of $35 - 40 k + by the end of 2018.
Watch my charts and listed regions below, enjoy!
UPON BREAKUP
- $6,850
- $7,812
- $8,900
CONTINUED DOWNTREND
- $4,778 (Primary)
- $3,199
CHARTS
Hourly Major Resistance at $6,300

Hourly Descending Triangle Breakout and Final Targets

Daily Descending Triangle Targets

Legal Disclaimer: I am only as good as guesses and fibonacci , i love to share my information however i am not telling anybody to specifically follow in any of the trades or decisions i make. I win , I lose but at the end of the day i use this all as a platform to share my opinions on possible outcomes and trades i will be completing. Happy Trading!