Ethereum and Bitcoin, the crypto giants. Charts and perspective..


ETH:BTC 30 minute candlesticks
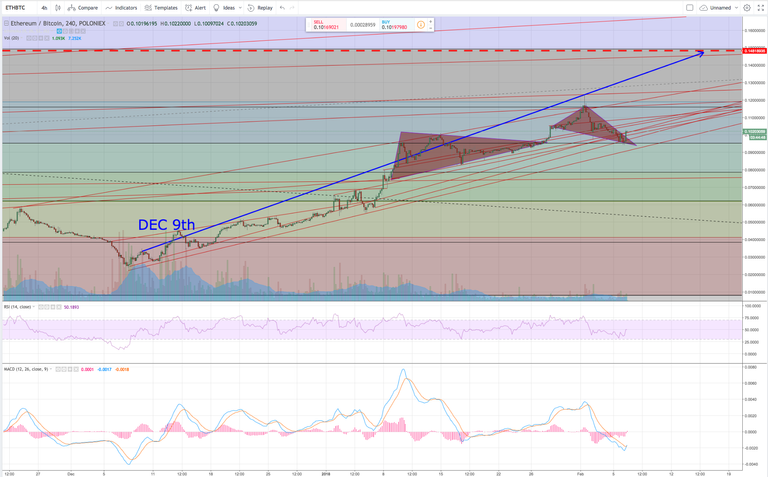
A closer look at the Ethereum uptrend and its pennant formations.
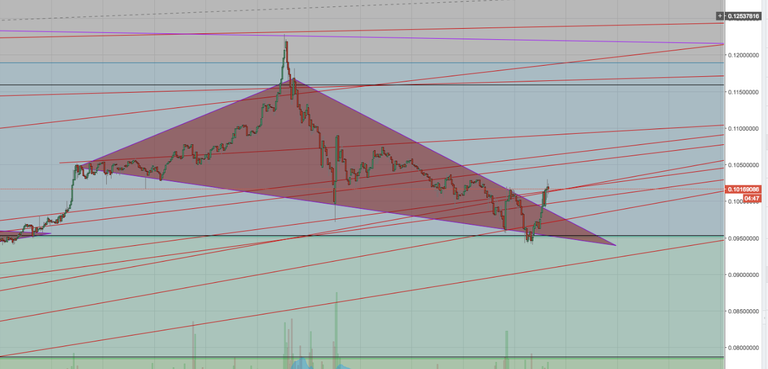
Ethereum is cooperating with the uptrending guidelines we've noted. All we can to is mark trend lines and observe.
Each and every move a wave makes can help us more accurately estimate where we may be headed.
There seems to be a widening separation between these two charts that is building tension. Ethereum is approaching its All Time High (ATH) in Bitcoin price at the 0.15BTC price range. It seems that this target would act as a resistance level opposed to a new support level. Please do your own chart analysis as well!
A look at the BTC:USD chart shows the opposite. Bitcoin has been in a strong and prolonged downtrend.

BTC:USD 1 week candlesticks
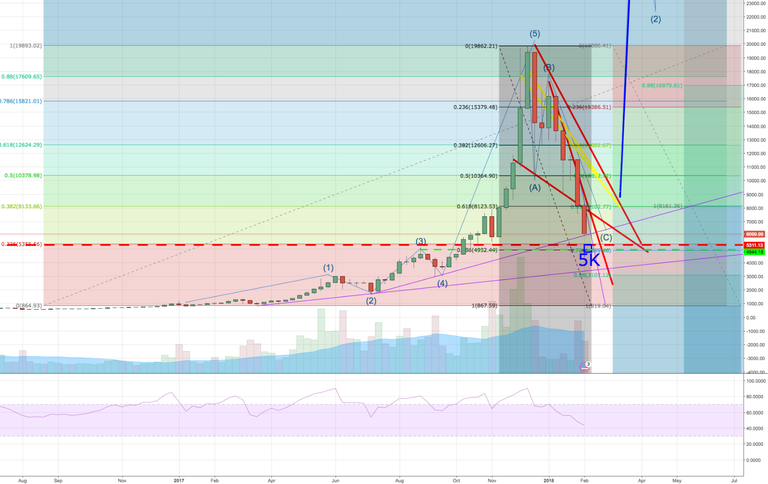
A closer look at the Bitcoin chart shows us the up and coming downward resistance we must break through.
$5,000 Bitcoin does not seem unlikely.
There is major support at that level, though this downward push is very strong.. and if we breach those levels, the Bitcoin bullrun may be at risk of collapse.
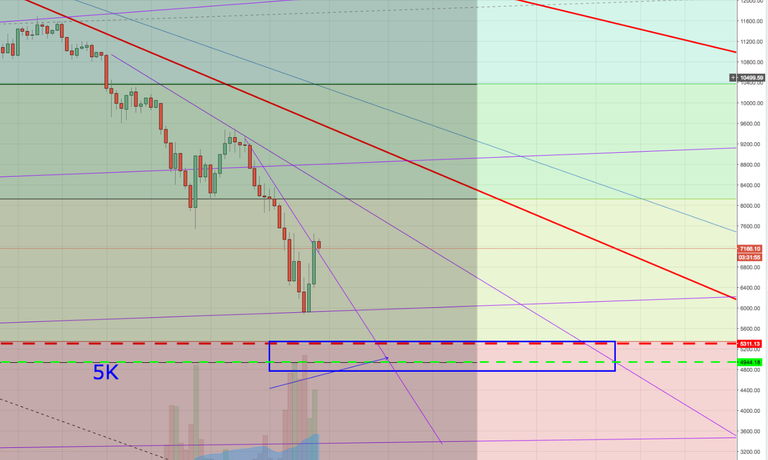
Remember to adjust the currency on https://coinmarketcap.com/
USD value

BTC value

Are you a little unclear as to what Bitcoin actually is? Check out our Bitcoin video
https://www.shredtoken.io/whatisbitcoin/
Check us out on our other channels too!
https://www.instagram.com/shredtoken/
https://www.youtube.com/channel/UCt7-iN40nrBdLyrjz-DCPzA?view_as=subscriber
https://twitter.com/ShredToken
https://www.linkedin.com/company/18371202/
Here is a great free place to start drawing lines and surfing the waves!
https://www.tradingview.com
