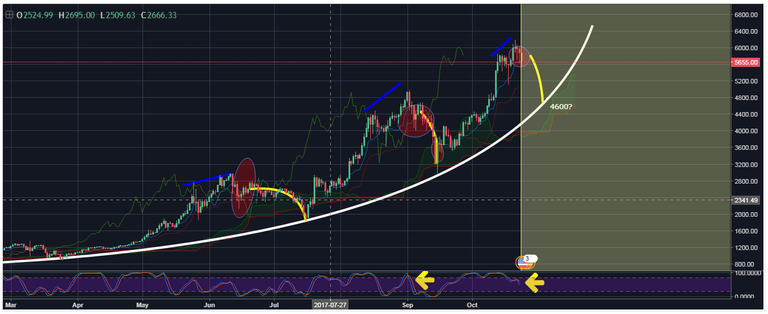
Hello. BTC is playing mind games with us but I think I have some math behind it this year. Its been a wild ride so is it going to pop or find support? Here we will show the path to 10K BTC and after that... it may pop and what ever happens people will need to remember to always buy the dip. The actual dip not the panic button buy dip.
Red circles you can see area of ATH 1.08% .
Blue lines represent the length in time from ATH 1.08% to the next small top.
Yellow line shows the dip and how its increased in steepness over the year. This is very important because math never lies and numbers are all around you.
Yellow arrows represent RSI . If you look at the blue and red lines, the blue crosses under the red before major correction. It is time for that correction. 
So lets talk math. There are three peaks you see here. In June-July you had an ATH 1.08% period of 8 days before correction. August September is 4 days. See the math? Its half... So this correction is 2 days of waiting for that correction. The ATH 1.08% happened October 21, 2017. It is 23rd October, two days. YOU will see such a drop in BTC that this chart will verify.
If you don't see it go below 5200, then that was a good bounce but be careful and always push play on this chart to see if it lines the yellow line. I was able to predict the exact moment ATH 1.08% happened on BTC . (see related)
With the upcoming forks and BTC Gold -0.44% and other things to affect pricing, this is the most logical outcome.
Again, don't take my word for it this is just me noticing patterns. Something I love to do and will always rely on. Its helped my trades and swings tremendously
Happy Trading! 
😎