Hi,
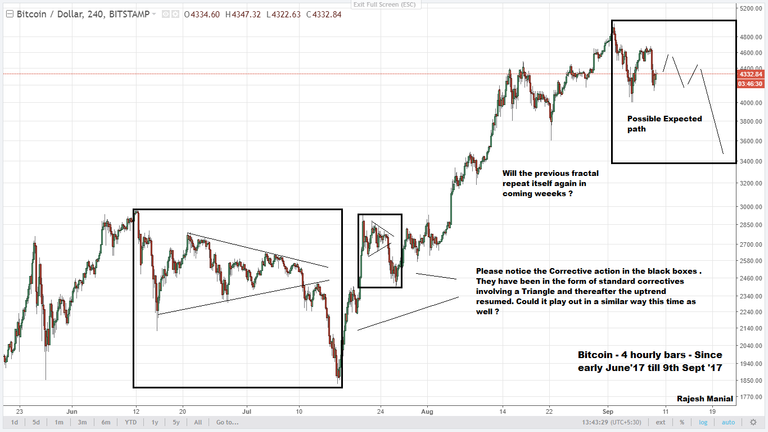
If one notices the Bitcoin Chart , the recent corrections since June '17 as marked on the chart here, were
standard correctives involving a Triangle.
Could the same pattern repeat again ?
If any bounce that we may see from here on is unable to clear the level of 4800 and stay above it for couple
of days and the decline resumes, then there is a possibility of the same corrective fractal repeating again .
Please refer to the charts for possible levels .

Congratulations @rajeshmanial! You have completed some achievement on Steemit and have been rewarded with new badge(s) :
Click on any badge to view your own Board of Honor on SteemitBoard.
For more information about SteemitBoard, click here
If you no longer want to receive notifications, reply to this comment with the word
STOPCongratulations @rajeshmanial! You have completed some achievement on Steemit and have been rewarded with new badge(s) :
Click on any badge to view your own Board of Honor on SteemitBoard.
For more information about SteemitBoard, click here
If you no longer want to receive notifications, reply to this comment with the word
STOP