Welcome to this exciting analysis on Bitcoin!
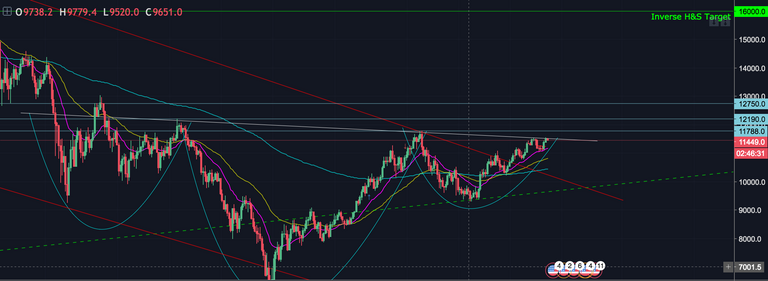
Looking at the 4 hour chart above, we can see that BTC is testing the head and shoulders neckline, currently trading at 11449.
We've successfully pierced the red downtrend channel, and a successful breakout of the H&S neckline will be extremely bullish. Overhead resistance is highlighted on the chart and sits at 11788, 12190, and 12,750. A break above the 12,750 resistance level will be further reinforcement for a run up to my inverse H&S Target of 16,000.
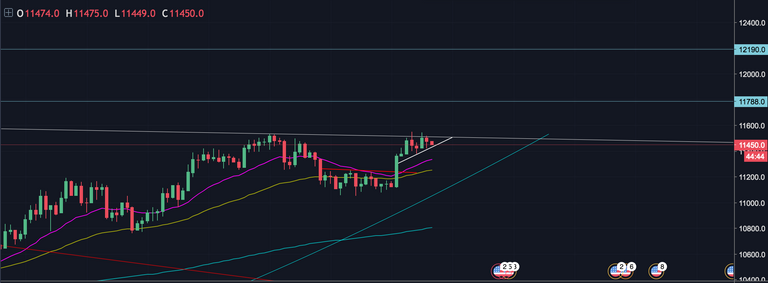
Lets take a closer look at the price action on the hourly chart:

We can see that BTC has appeared to form an ascending bull flag with the top being the H&S neckline. I think we are coming very close to a decisive move in price action, and in my opinion the odds are very bullish.
Congratulations @quantify! You received a personal award!
You can view your badges on your Steem Board and compare to others on the Steem Ranking
Do not miss the last post from @steemitboard:
Vote for @Steemitboard as a witness to get one more award and increased upvotes!