SUMMARY
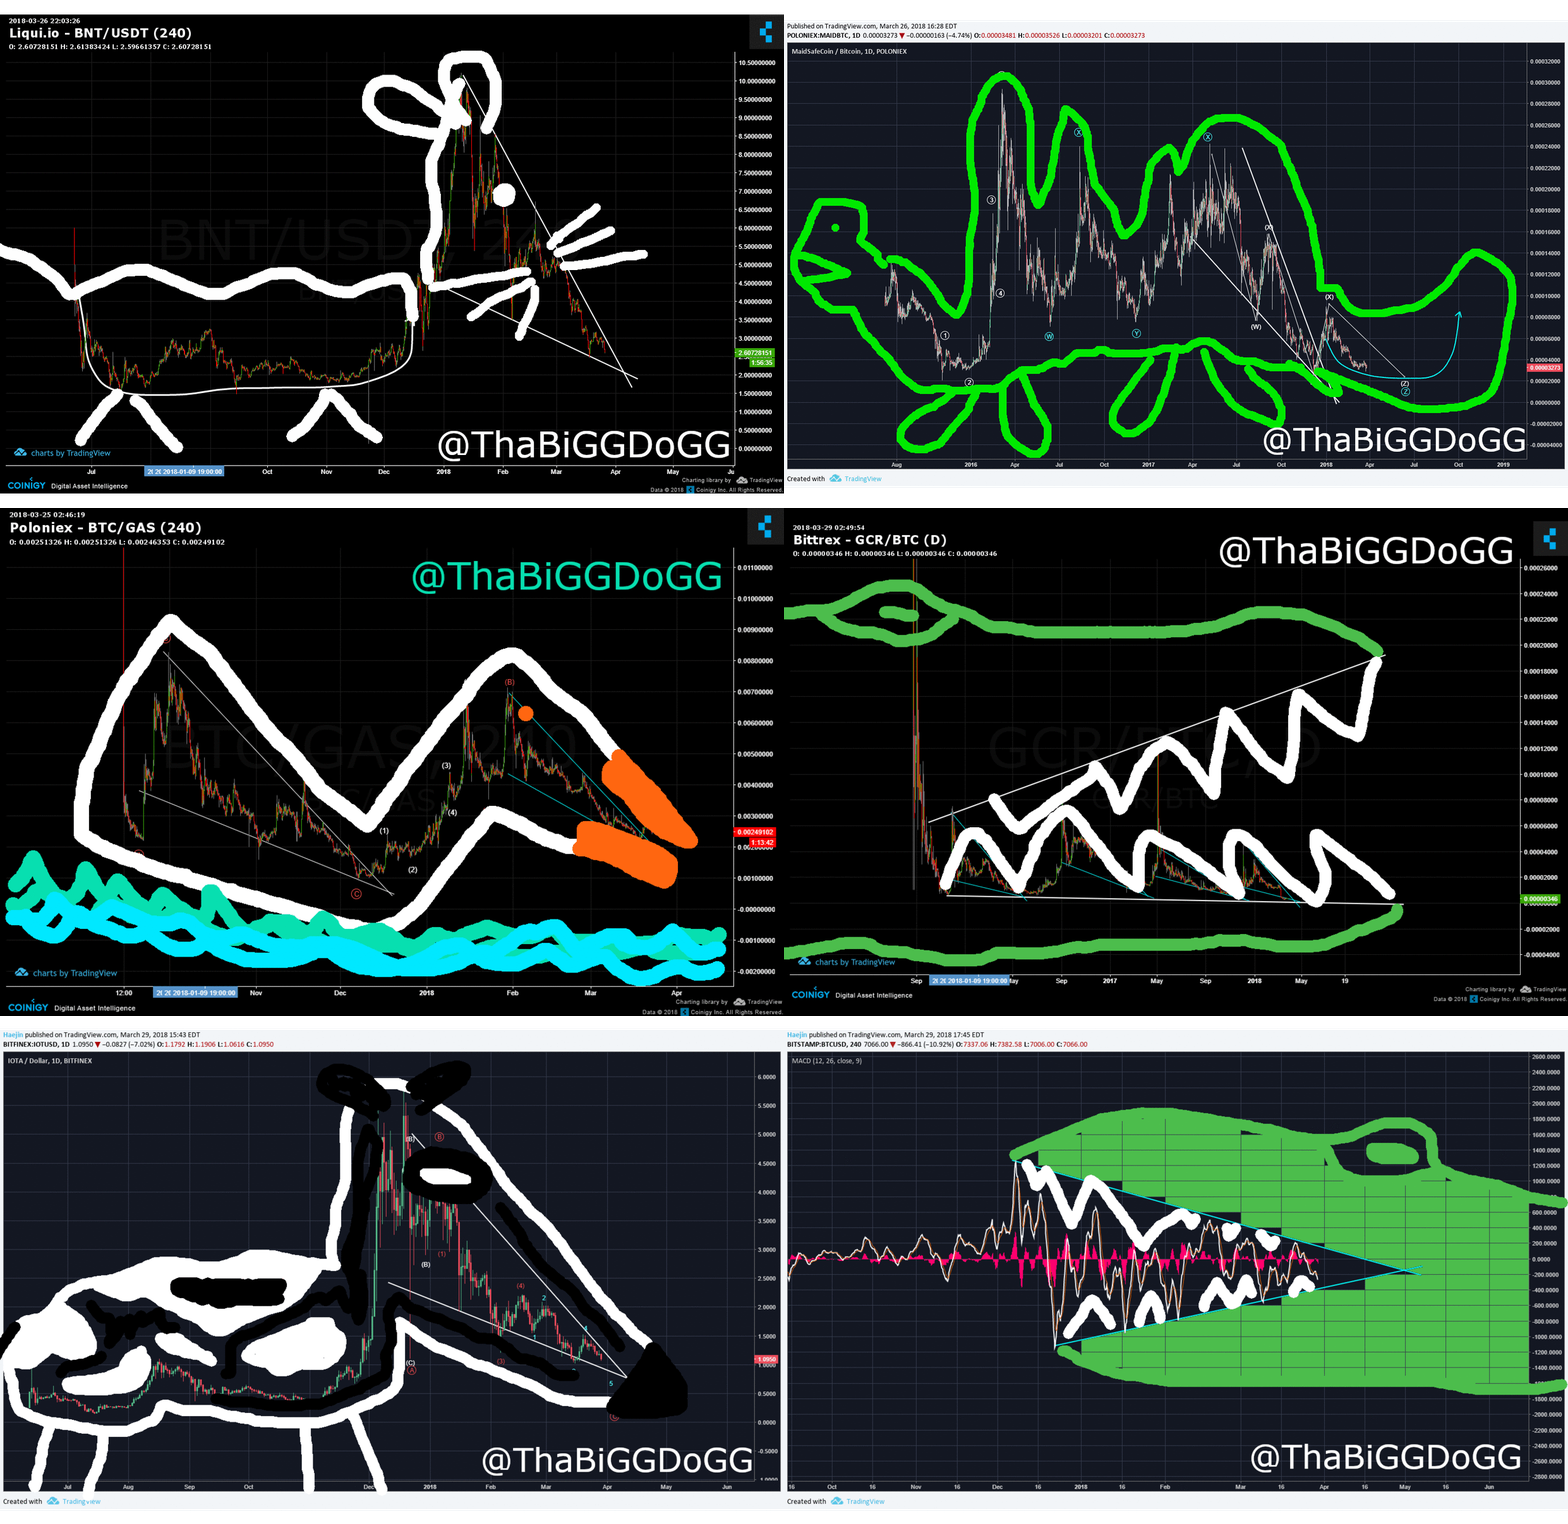
No, I wasn't bored nor did I have too much time on my hands. I always wish humand never had to sleep and had 48 hours ina day! I made this cartoon based Bitcoin (BTC) fractal to emphasize how needlelike price dips have it the blue long term support line before and it is doing so again. IF this support holds as it has for months now, price is expected to bounce in a near V-like move. It'll be like when one senses the sudden bite of a mosquito; the reaction is reflexive!
The below chart shows that something has to give. It'll either be the long term support or the resistance on the price or MACD symmetrical triangle. When bullish wedges (downward pointing) are consecutive and embedded within a larger pattern (imgrenated); outcome probabilty leans towards bullish. There could be a piercing of the support lines but it'll have to be temporary; eg no more than a day or so and price will have to return back inside the triangle. IF so, this would be a bull wick. Let's see how the overnight price action takes place.
Legal Disclaimer: I am not a financial advisor nor is any content in this article presented as financial advice. The informa
Lolllzzzzzz
My Charts are still better. I have 25+ years background in MS PAINT!!! You do not have the skills I do!!!

Honestly, that's some good artwork.