Bitcoin's drop to 3-month lows below $6,000 could be seen as the completion of a round trip.
On Nov. 1, bitcoin (BTC) prices received a shot in the arm on news that derivatives marketplace operators CME Group, Cboe and Cantor Fitzgerald were considering launching futures for the market in December. It was widely believed that BTC would zoom to dizzying heights as a move to the mainstream would open doors for a bigger kind of whale.
The speculation drove prices higher to $10,000 in November, and the sharp rise and resulting fear of missing out established a positive feedback loop, one that sent prices to $20,000 by mid-December.
However, since then, the BTC has been steadily losing altitude.
A stream of negative news concerning regulatory crackdowns in some of the world's largest markets – China and South Korea – pushed BTC below the $10,000 mark in mid-January. That said, the drop witnessed in the last five days could be associated with the decision of major banks to bar customers from buying bitcoin with credit cards. China's decision to block access to foreign cryptocurrency platforms has only worsened the sentiment.
As of now, bitcoin is trading around $6,500 – a level last seen on November 1.
Indeed, market forces have not worked as anticipated by many. The Dow index fell more than 1,000 points yesterday, triggering a wave of risk aversion in the equity markets across the globe. However, it has not had any positive impact on bitcoin, despite its status as a "digital gold."
That said, the oversold BTC could see a relief rally if the Senate adopts a softer approach to regulating cryptocurrencies than China.
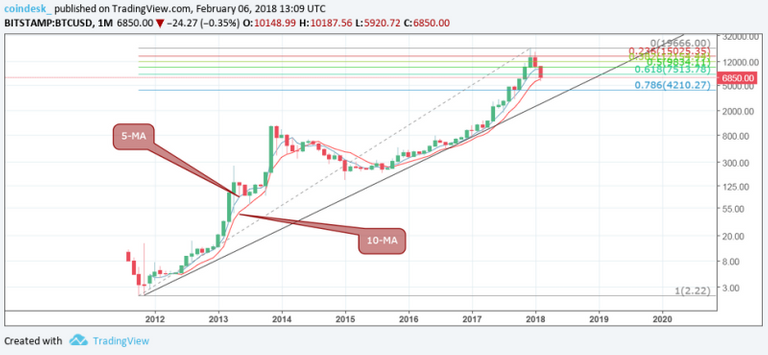
Bitcoin monthly chart

The above chart (prices as per Bitstamp) shows:
BTC has retracted more than 61.8 percent of the rally from Oct. 2011 low of $2.22 to Dec. 2017 high of $19,666.
Bears are struggling to keep bitcoin below the 10-month moving average (MA). Currently, the MA is seen at $6,372 and is biased bullish.
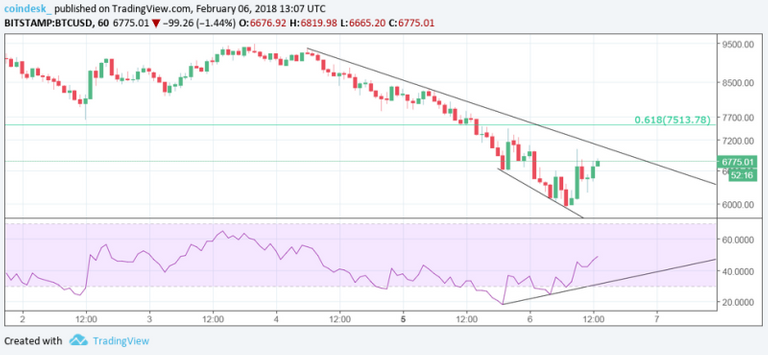
Further, the relative strength index (RSI) on the daily chart, 1-hour chart, and 4-hour chart shows oversold conditions.
Also, the 1-hour chart seen below shows a bullish price-RSI divergence, which indicates BTC may have found a temporary low at $5,920.72.
1-hour chart

-All the above-listed factors indicate scope for a corrective rally in bitcoin.
-Prices are likely to break above the descending trendline hurdle (seen in the 1-hour chart) and revisit the 200-day MA located at $7,913.
-However, further gains are unlikely in the short-run as the 5-day MA and 10-day MA carry a strong bearish bias. Usually, an asset sees sustainable rally after the short-term moving averages have bottomed out. Also, the weekly chart shows a bearish crossover between the 5-MA and 10-MA.
-On the downside, a daily close (as per UTC) below $6,000 would expose support at $4,210 (78.6 percent of the rally from Oct. 2011 low of $2.22 to Dec. 2017 high of $19,666).
Thread and spool via Shutterstock
Hi! I am a robot. I just upvoted you! I found similar content that readers might be interested in:
https://finance.yahoo.com/news/bitcoin-apos-price-nearly-unwound-133013373.html