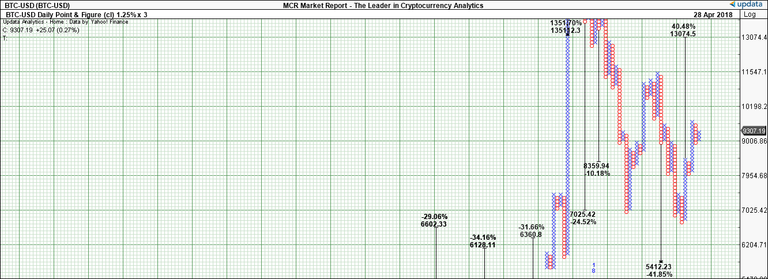
Point-and-figure charting, used on Wall Street for over 100 years by the largest institutions (although they don't admit to it), is currently indicating a price target of $12,573 for Bitcoin, a 35.1% increase from the current price, based on recent price action. Point and Figure charting is used by professionals to reduce the "noise" of charts and detect the true underlying trend. Point and Figure price projections are one of the most accurate price forecasting tools we are aware of. Many of the previous targets shown on the chart below were ultimately met or exceeded.

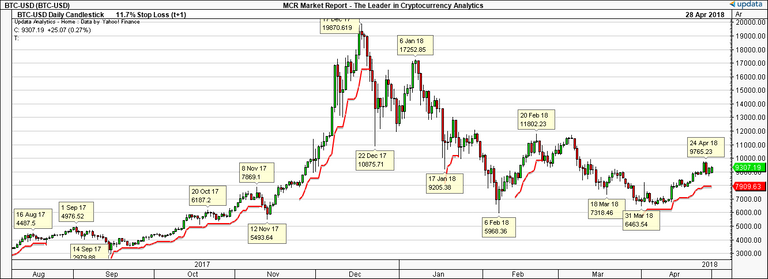
In addition, some readers have asked for a current stop-loss level for Bitcoin trading, and while we don't officially use them in our trading our software provides them and we'll share them with you. Over the past year, the optimized stop loss is -11.7% from current prices--currently $7909.

We use Point and Figure charting extensively as cryptocurrency quantitative analysts. For those wishing to learn more about this powerful charting technique we highly recommend Jeremy Du Plessis book The Definitive Guide to Point and Figure

Congratulations @mcrmarketreport! You have completed some achievement on Steemit and have been rewarded with new badge(s) :
Click on any badge to view your own Board of Honor on SteemitBoard.
For more information about SteemitBoard, click here
If you no longer want to receive notifications, reply to this comment with the word
STOPCongratulations @mcrmarketreport! You received a personal award!
You can view your badges on your Steem Board and compare to others on the Steem Ranking
Vote for @Steemitboard as a witness to get one more award and increased upvotes!