In this article, I will state a fact and ask some questions. They will be very brief and I will not provide answers myself herein. You are encouraged to provide your answers. I will do so on a later date as well.
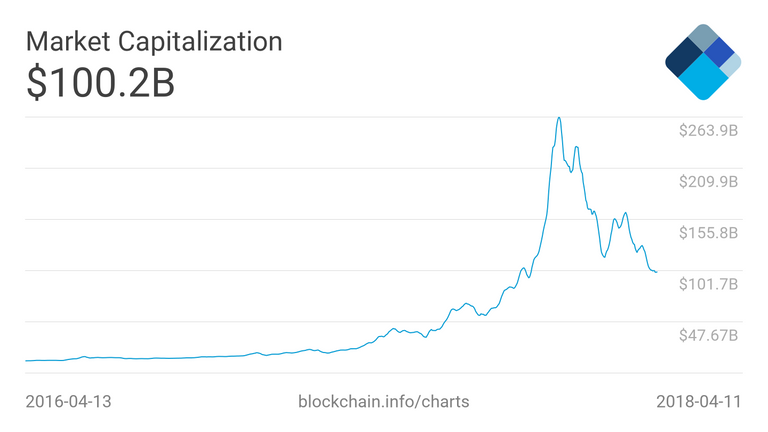
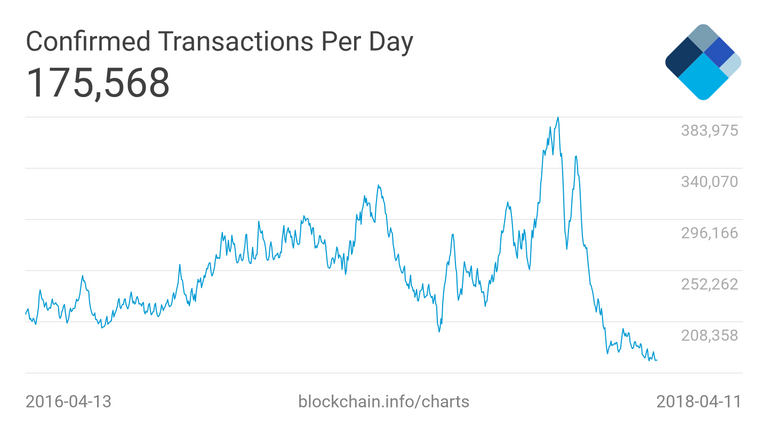
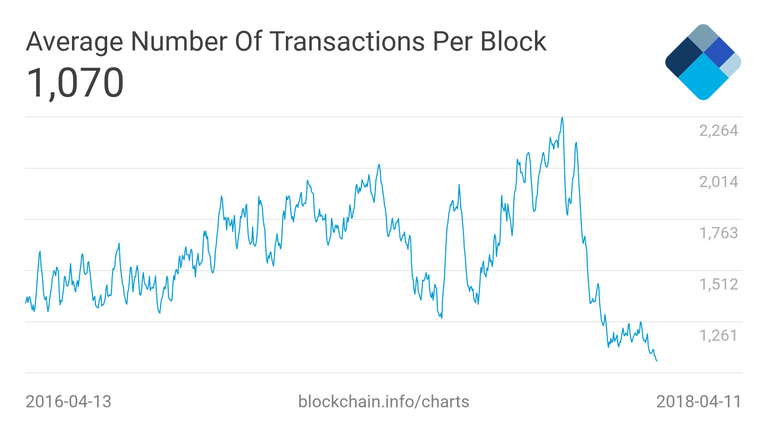
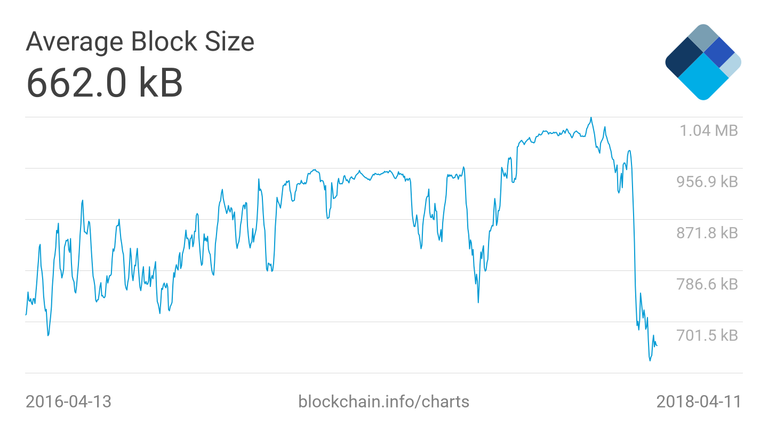
All data is from blockchain.info. Each chart covers 2 years, smoothed by 7 day average and depicted on a linear scale. First date is April 13, 2016 and the final date is April 11, 2018.
Fact :
2 years ago Bitcoin market capitalization (network value) was USD 6.5 billion. There has been a near 16x increase.
Question 1:
Why are the confirmed transactions 10% lower than 2 years ago and at a 2 year low? (while the market cap is up by 16x)
Question 2:
Why are the average number of transactions per block 20% below 2 years ago and at a 2 year low? (while the market cap is up by 16x)
Question 3:
Why is the average block size at its lowest in 2 years? (while the market cap is up by 16x)
Question 4:
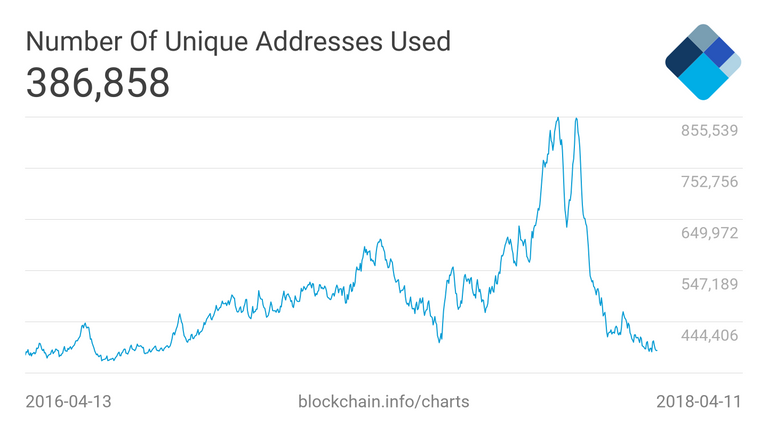
Why are the number of unique addresses used unchanged from 2 years ago? (while the market cap is up by 16x)
Question 5:
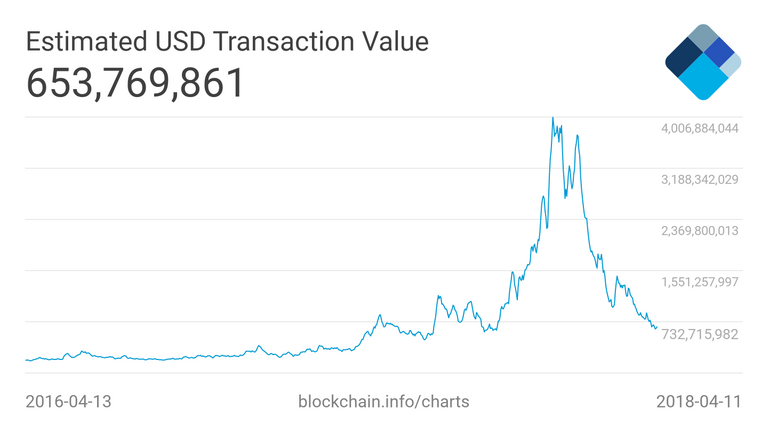
Why are the estimated USD transaction value per day is up only 6x? (while the market cap is up by 16x)
So while the price jumps over 15% in a day after a long slide from December 2017, it might be prudent to consider the relationship between price and network activity.
Vikram Arun has an insightful article on NVT and NVTG here: https://medium.com/ledgercapital/using-nvt-and-nvtg-in-practice-to-value-the-most-popular-cryptocurrencies-a66c6abc0a83
Coinmetrics NTV charting tool can be accessed here: https://coinmetrics.io/nvt/#assets=btc_log=false_roll=14_zoom=1453547284897.959,1523404800000
Blockchain.info’s charts are at: https://blockchain.info/charts
I’ve posed the questions, your answers are more than welcome and we’ll revisit this post in around 6 months to review the stats and provide some insight. Meanwhile I might post answers along the way as well..
Here are my preliminary answers to the questions:
Cumulatively — there is a disconnect between BTC price and network activitiy.
This disconnect is even more apparent in other coins.
However, this disconnect might be partly caused by (i) individiual buy and hold investors, (ii) institutional buy and hold investors, (iii) some knock down effect from cloud mining profit squeeze and (iv) after effects of price falls (some people leaving the market, some paying less attention, some expecting further falls).
So if a growing percentage of BTC holders are holding on for store of value reasons rather than usage aims, then the disconnect may be the new normal.
Again — months later, we’ll know better. My own hunch is that the disconnect is real but might not be that price detrimental.
Anyhow, I reserve the right to contradict myself later.
@gaman, because you continue to spam the blockchain, you get a flag! Please stop.