Time: 8.18 A.M. / GM+2 / 8th Mar, 2018 – Thurs.
In our previous post / 519 / we had forecast the trading range will be between 10K and 11.70K, the intraday high was 10.8K, and the low was 9.4K, due to a rejection at 11.791K.
Bitcoin price traded with negativity, breaking 10.7K and settles below it. More decline toward 9.4K - 8.7K is expected, due to the low volume. But as the price is above 8.7K, the trend is slighty bullish and we still believe the inverted head and shoulders pattern ( We did draw the above chart on Feb 21 ), have a big chance to push the price toward 12.8K, 13.7K to hit finally 15K before the end of march.
Bears fighting but the trend is still slighty bullish. Technical indicators suggest a potential pickup:
- Option 1 / The price will re-test 8.7K before any new attempt to rise again.
- Option 2 / The price could still bounce from 9.4K to re-visit 11.791K.
Bitcoin is currently trading around 9.75K at time of writing and the trend is slighty bullish for today, conditioned by stability above 8.7K. The reason why I come up with the above 2 options as I believe a strong bullish momentum might lead to continuation of bull run.
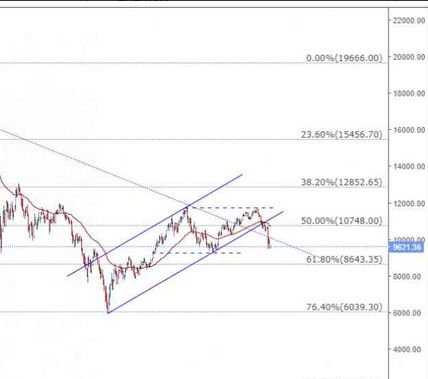
Support : 8700.00 level (Major).
Resistance : 10700.00 level (Major).
Expected trading for today:
is between 8700.00 support and 10700.00 resistance.
Expected trend for today :
Slighty Bullish.
Medium Term:
Bullish.
Long Term:
Bullish.
The low of 2018:
5947.00 / IHS Bottom.
The high of 2018:
25000.00 level / Expected.

Really good technical analysis, very informative. Hoping to see some more positive moves by this weekend. I think it looks like it may bounce from support at 9.4k-9.5k area.
The biggest challenge for crypto today is centralized exchanges. Mass adoption of decentralized xchanges will cement the bullish trend.
BTC usually go down lowest of the week start Friday thru Sunday......down to $8.7 then move up from there around Monday?
complete turnaround of events yesterday lot of Fear no volumes seems like it will be bearish like previous year
It's a interesting and an important post ..... you have some great information here ..... waiting for your next post. Thank you...
good analisys and informative, this is a great post @lordoftruth
please visit to my blog @arijuang , if you have any time please read and leave respons , If you like my post, upvote, and resteem :)
This post has received a 10.79 % upvote from @boomerang.
back in the $10K range hopefully it will be going up
Bearish trend has started.looking at 1 hour and 4 hour charts need to look at 1 week charts.its just my analysis its not an financial advice.
This post has received a 8.00 % upvote from @booster thanks to: @lordoftruth.
the bullish momentum will continue for sure after the sudden dip
@lordoftruth sir....
The Bitcoin Elliott Wave forecast suggests that the bearish patterns are dominating so long as Bitcoin prices remain below $14,000.
Bitcoin Elliott Wave Analysis Talking Points:
Bitcoin prices have been contained inside a downward sloping price channel
Recovery from January 17 to January 20 takes the shape of a corrective zigzag pattern...
Pressure remains to the downside so long as prices remain below the upper channel line
Bitcoin prices are falling within a downward price channel. It is possible this downward wave since December 17 is a bearish zigzag and the first wave of a larger correction or perhaps the beginning of a larger bearish impulse. As I contemplate the potential for bullish patterns, the models return results that are temporary and short lived. As a result, this cryptocurrency is operating in a sell the rally environment until we see a bullish motive wave develop.
BITCOIN PRICE CHARTS OFFER CORRECTIVE RALLIES..
The Bitcoin price rally that began on January 17 appears to be a three-wave rally. According to the Elliott Wave principle, three wave moves are corrective and tend to be completely retraced. Therefore, the January 17 – 20 rally raises the probability that Bitcoin prices may continue to be pressured to the downside.
Though the January 17-20 trend appears to be a corrective rally, Bitcoin prices can continue to increase to extend the correction in price and time....
Thanks sir...
bitcoin earn is my dream.
very bearish trend all the way hopefully will be picking up after sometime
Head shoulder knees and toes pattern? Upsidown man! Looks like a long term bull to me too! 😉 If you catch my meaning.
really great post very useful for me, thank you for vote and post your comment please follow me, please help me same with you, good friends comrade comrade