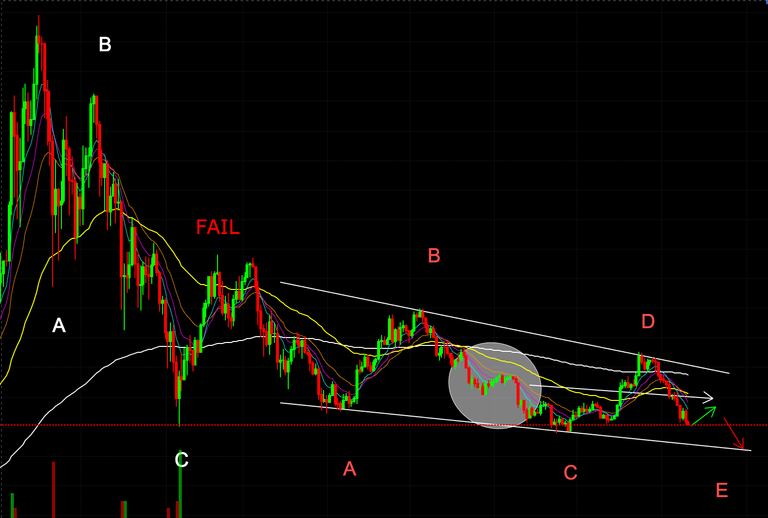
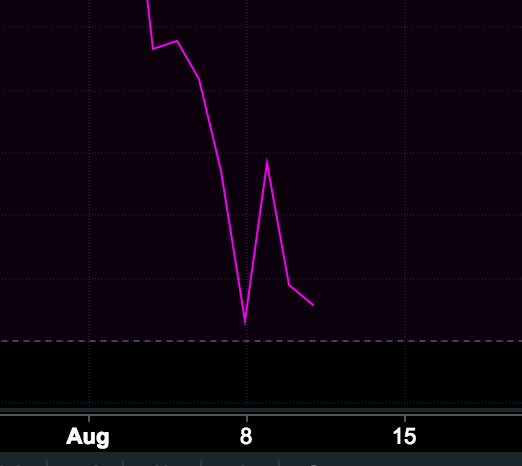
Bullish divergence on daily so some sort of uptrend (green arrow) is expected before the next down leg (red arrow) witch most likely will stop at the channel resistance at 5200$. It's look like this downtrend repeating the last one from May and June.


Follow me on steemit to be updated!
Buy me a beer if you are happy with my TAs
Bitcoin: 3DQkWWrtD7nL1nHLKzQXQt2s13bAkDeasz
Ethereum: 0x893dbBE19b7F3622227aAd21f2c84Fb8806EE091
Litecoin: MAa339STqrC6MBqniqKXiWPPhH1AonSYWk
Legal Disclaimer: This blog post and the materials in it are for informational purposes only. I'm not an financial advisor. This is only my opinion. It is not advice or recommendation to buy or sell according to provided information about the price movements and I am not liable for any pecuniary damages!