( )
)
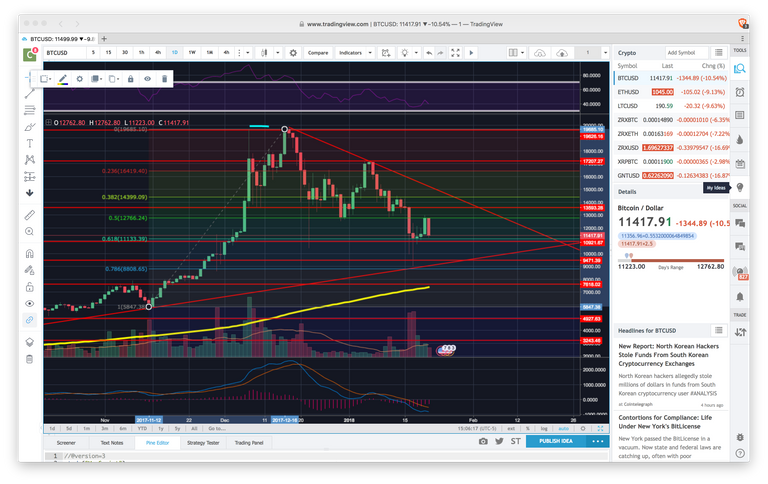
BitCoin has been having a hard week breaking the 12.7k mark. Its been using the 61.8% retracement line as support, roughly around the 10,921~ area. With this move down today, BTC has been following a daily downtrend since December 11th, 2017. Although overall still following a weekly uptrend of some sort. Once it breaks through 10,921 and continues down, it'll find support again near the 9,471 area. And if it breaks through the support line at 9,471, then the next stop would be 7,618~ On the daily chart, BTCUSD RSI is approaching the oversold region, and MACD and signal lines seem to be getting closer. MACD Histogram is currently following the price movement, so maybe 9,471 is an area we'll see by tonight or tomorrow.
Disclaimer: This is my, Lee's Investment, own analysis of the CryptoCurrency chart(s). These are not to be taken as Certified Financial Advisor positions. Take these trades at your own risk. Lee's Investment, is not a certified advisory firm, and is only providing information for educational purposes. You are required to perform your own due diligence to take these trades. You should always check with your licensed financial advisor and tax advisor to determine the suitability of any investment.