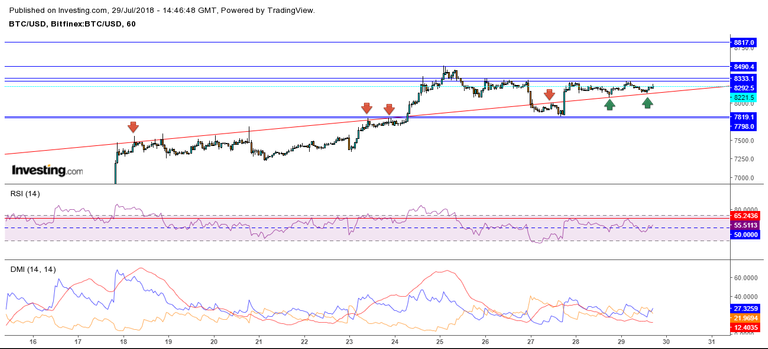
Btc/usd paritesi şu an yükseliş trendinde ve kırmızı trend çizgisi yükseliş trendinin destek çizgisini oluşturmakta
Rsı ve macd göstergelerine baktığımızda olası hareketler 8292-8333 bandına doğru olacak gibi görünmektedir.
Eğer bu bandı kırarsa fiyat 8490 seviyelerine kadar çıkabilir.eğer çıkışlar devam ederse rsı indikatörü dikkatle izlenmeli
Eğer fiyat kırmızı trend çizgisini aşağı kırarsa fiyatda 7798-7819 bandına kadar geri çekilmeler görülebilir.
UYARI:Burada yer alan bilgiler yazarın şahsi fikirleridir.kesinlikle yatırım tavsiyesi değildir.

The Btc / usd parity is currently on the uptrend and the red trend line constitutes the support line of the bullish trend.
When we look at the RSI and MACD indicators, the possible movements seem to be towards the band 8292-8333.
If you break this band, the price can go up to 8490.
RSI indicator should be monitored carefully if outages continue.
If the price breaks down the red trend line, the price can be seen to withdraw to the band 7798-7819.
Warning:the information contained herein is the author's own personal imagination,it is definitely not investment advice