Bitcoin :
Bitcoin is leading the recovery from the front. It has bounced sharply from its recent lows of $6,120.45. The probability of a bullish inverse head and shoulders (H&S) pattern is still alive. The inverted H&S will complete on a breakout and close above the neckline at $6,953.38. This gives it a pattern target of $7,996.11.
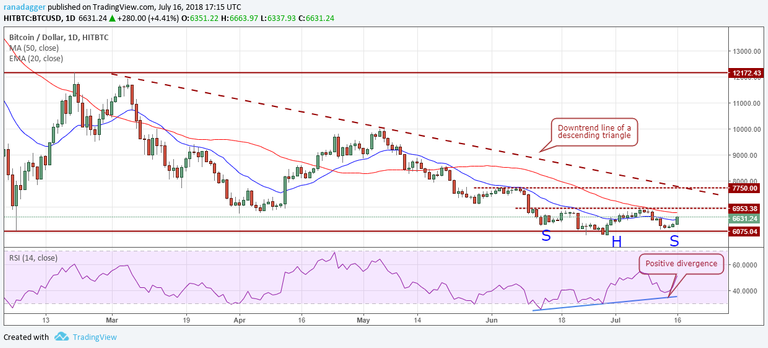
Once the BTC/USD pair scales above the $7,000 levels, it doesn’t have any significant resistance until $7,750.
The digital currency will pick up momentum above the downtrend line, which will invalidate a bearish descending triangle pattern. Failure of a bearish pattern is a bullish sign and can result in a rally to $10,000 in the medium-term.
The rallies this year will be much more muted when compared to the scorching rally in 2017. Hence, the investors should be patient and ready for a volatile ride. Therefore, please keep the position sizes small until a clear uptrend begins.
The stops on the long positions initiated at $6,650 can be maintained at $5,900.!
Ethereum :
Ethereum looks strong as it has broken out of the 20-day EMA. It can now rally to the overhead resistance at $496.36 where we expect another round of selling by the bears.
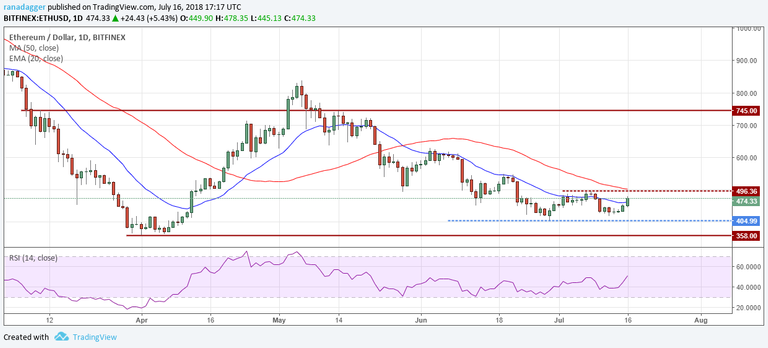
If the bulls scale above $500, a rally to $600 is probable with a minor resistance at $550. Therefore, we suggest a long position above $500 with the stops below the recent lows at $400. The traders can raise their stops to break even if the ETH/USD pair struggles to break out of $550.
Though the risk to reward ratio is not very attractive, we are going ahead with the recommendation because Ethereum has been an outperformer, as it has stayed well above its April lows. Hence, we expect it to quickly move up towards its target levels.
Ripple :
The bears have failed to benefit from the breakdown of the $0.45351 levels on Ripple. This has attracted cherry-picking by a few aggressive bulls.
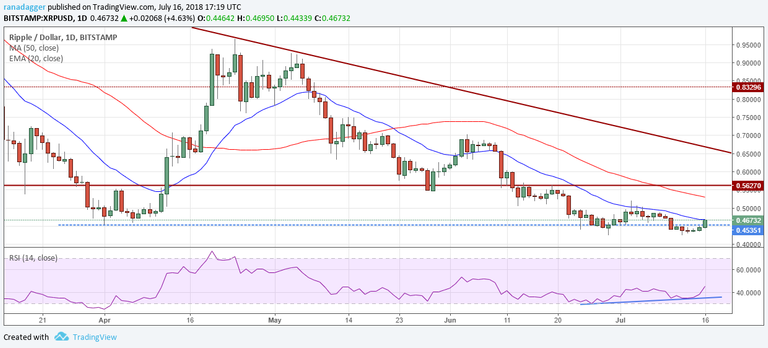
The XRP/USD pair has reached the 20-day EMA, which might act as resistance. Above this, the next hurdle will be at $0.5 and finally at $0.56270.
The digital currency has been a huge underperformer. That’s why we need to wait for it to form a new buy setup before recommending any trade on it.
Bitcoin Cash :
Bitcoin Cash has rebounded from the $669 levels and has broken out of the 20-day EMA. It can now move up to the downtrend line, which will act as resistance.
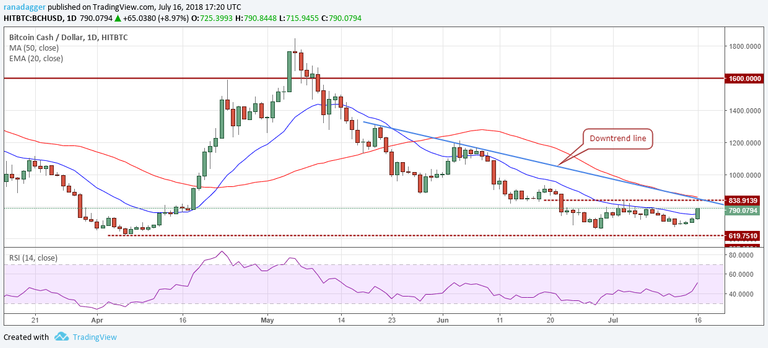
If the bulls break out of the downtrend line and the overhead resistance at $838.9139, the BCH/USD pair should move up to $1,200 with minor resistances at $934.2316.
The traders can buy if the bulls sustain above $850 for four hours and keep a stop below the recent lows; the digital currency has a history surprising traders with vertical rallies.
Our positive view will be invalidated if the bears sink Bitcoin Cash below the $657 levels.
EOS :
EOS has bounced off the $6.55 levels and has reached the downtrend line. The 20-day EMA is also located just above the moving average. We expect strong resistance by the bears at this level.
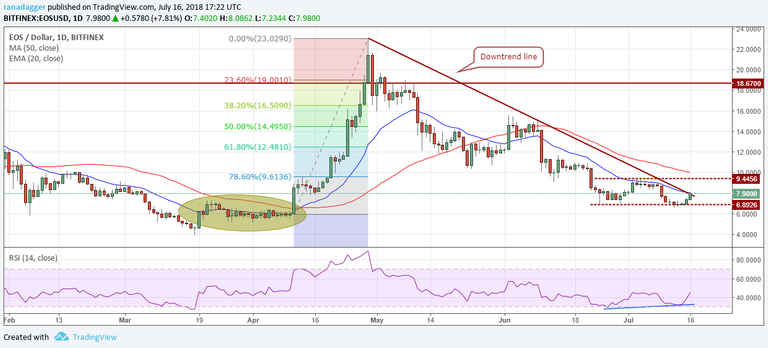
If the bulls break out of this, we might see a move to $9.4456, where the EOS/USD pair will again face strong selling pressure.
We propose long positions once the digital currency sustains above $9.4456 levels. The pattern target of this trade is $11.9986. If the bulls scale above this, a rally to $15 is likely.
Litecoin :
Litecoin has pulled back to the 20-day EMA, which is major resistance. The bulls have not been able to break out of this moving average since May 10 of this year.
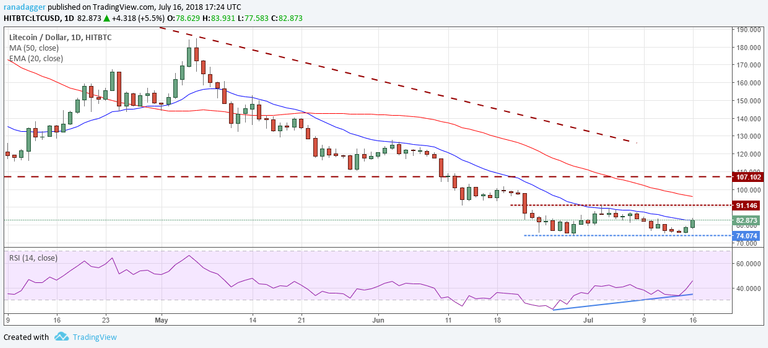
If the LTC/USD pair breaks out of the 20-day EMA, it can rise to the $91.146. A breakout of this level will complete a double bottom pattern, which has a target of $108.
However, we anticipate the digital currency to face stiff resistance in the zone of $102-$107. We’ll wait for the bulls to sustain above $107 before suggesting any long positions. Our bullish assumption will be invalidated if the bears break down below $74.
ADA :
The failure of the bears to break below the $0.13 levels has attracted buying near the lows. Subsequently, Cardano has scaled above the 20-day EMA and is close to the 50-day SMA.
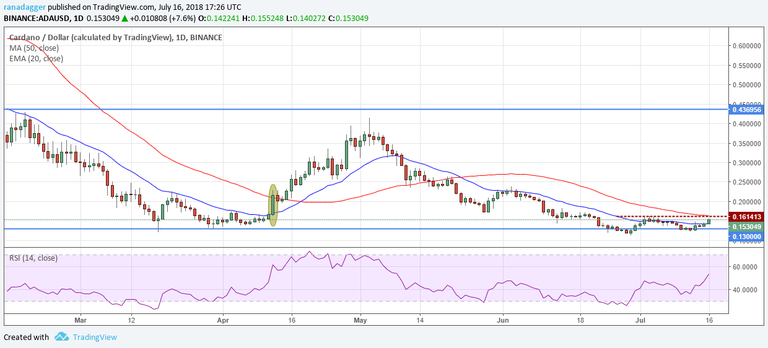
We believe a breakout above the overhead resistance of $0.161413 can result in a rally to $0.23.
Therefore, the traders can buy if the ADA/USD pair sustains the breakout above $0.162 for four hours. The stop loss for the trade can be kept at $0.11.
If the bulls struggle to scale above $0.181617 levels, the traders can raise the stops to break even to reduce the risk. But the investors can hold their trades because they can expect a rally to $0.43 in the long-term.
Stellar :
Stellar has rebounded sharply from the lows and has reached the 50-day SMA, which is offering some resistance.
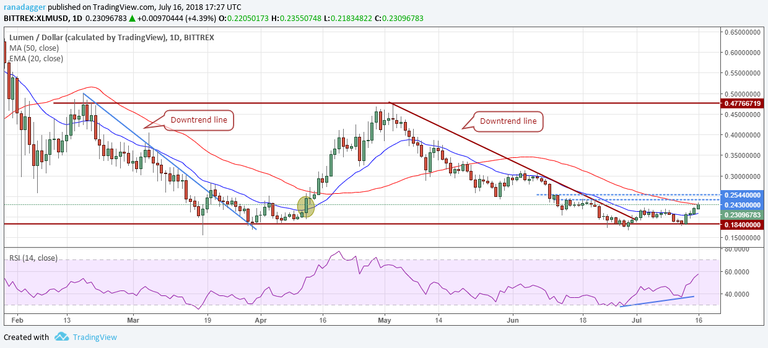
The XLM/USD pair might face selling in the zone of $0.243-$0.2544. Once this zone is crossed, a rally to $0.30 is likely.
As the bulls have defended the bottom of the large range, we anticipate a move to the top of the range in the long-term. Therefore, long-term investors can buy around $0.255 with a stop below the June 29 lows, with a target of $0.477.
The traders should wait for a minor dip or consolidation to form around the $0.255 levels and then buy the breakout of it. That will provide them with a closer stop loss, keeping the risk to reward ratio favorable.
IOTA :
The stop loss on the long position recommended earlier has not been hit, as the bulls defended the $0.9150 levels on IOTA.
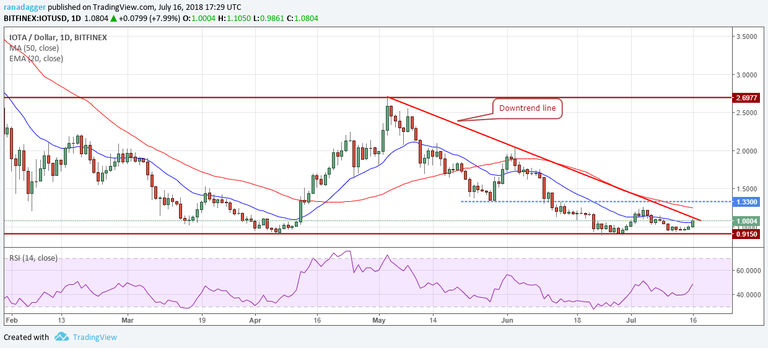
The downtrend line might act as resistance during the pullback but if this level is crossed, the IOTA/USD pair can move up to 1.2579.
We anticipate some selling pressure between $1.2579-$1.33. Once this resistance zone is crossed, a rally to $2 should be on the cards.
Therefore, traders are suggested to hold their long positions with the stops at $0.8850. We shall trail them higher at the first available opportunity.
TRX :
Tron is trying to bounce off the support levels at $0.03275. It has pulled back to the 20-day EMA, which is likely to offer strong resistance. The bulls have not been able to scale this moving average convincingly since May 22 of this year.
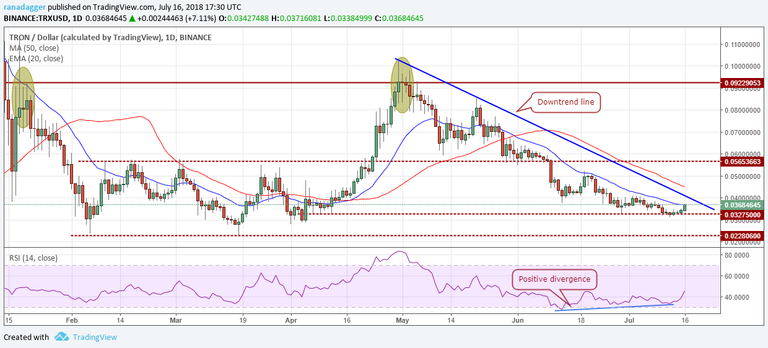
So, a breakout of the 20-day EMA will be the first indication that the downtrend is losing steam.
We’ll turn positive after the TRX/USD pair breaks out of the downtrend line. Our bullish view will be invalidated if the prices turn down around either from the 20-day EMA or the downtrend line and sink below $0.03275.
@kamboj it's good information but it's huge to read😂😂
agree wid u
Hahahahahaha..........ya bro
@kamboj nice to creat bot
Congratulations @kamboj! You have completed the following achievement on Steemit and have been rewarded with new badge(s) :
Click on the badge to view your Board of Honor.
If you no longer want to receive notifications, reply to this comment with the word
STOPTo support your work, I also upvoted your post!
Do not miss the last post from @steemitboard:
SteemitBoard World Cup Contest - The results, the winners and the prizes
Congratulations @kamboj! You have completed the following achievement on Steemit and have been rewarded with new badge(s) :
Click on the badge to view your Board of Honor.
If you no longer want to receive notifications, reply to this comment with the word
STOPDo not miss the last post from @steemitboard:
SteemitBoard World Cup Contest - The results, the winners and the prizes
introduction post or the other great posts I already resteemed.Resteemed by @resteembot! Good Luck! Check @resteembot's
Congratulations @kamboj! You received a personal award!
You can view your badges on your Steem Board and compare to others on the Steem Ranking
Do not miss the last post from @steemitboard:
Vote for @Steemitboard as a witness to get one more award and increased upvotes!
Congratulations @kamboj! You received a personal award!
You can view your badges on your Steem Board and compare to others on the Steem Ranking
Do not miss the last post from @steemitboard:
Vote for @Steemitboard as a witness to get one more award and increased upvotes!