Candlestick charts are an effective way of visualizing price movements but first you should know what is a candlestick and its parts. Candlesticks are an efficient way to view an asset's price chart. Candlesticks quickly show which way the price moved during a specific time period using colors, as well as how far the price moved during that period.
Candlesticks are popular because of their visual appeal, compared to bar or line charts. Each "candle" represents a certain amount of time, which is selected in the trading platform or in the chart settings. Popular candlestick time frames for day trading include tick charts, 1-minute and 5-minute time frames. If using a 5-minute time frame, each candle will show the high, low, open and closing price (discussed below) for that 5-minute period, as well as show the direction the price moved during that five minutes. After five minutes a new candle will begin, showing the data for that five minute period. Candles can be created for any time frame, and any market you wish. Nearly every charting platform available today provides candlestick charts.
There are two basic candlesticks:
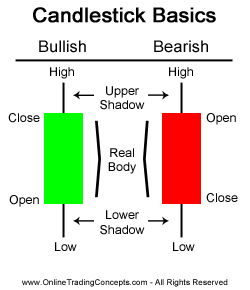
Bullish Candle: When the close is higher than the open (usually green or white)
Bearish Candle: When the close is lower than the open (usually red or black)
bullish and bearish candlestick chart patterns

There are three main parts to a candlestick:
Upper Shadow: The vertical line between the high of the day and the close (bullish candle) or open (bearish candle)
Real Body: The difference between the open and close; colored portion of the candlestick
Lower Shadow: The vertical line between the low of the day and the open (bullish candle) or close (bearish candle)
Candlestick charts are popular due to their visual nature, but they don't provide any more information than a OHLC chart (open, high, low, close). Candlesticks show the open, high, low and close for a period, where the difference between the open and close is marked with the real body. Wicks or tails mark the high and low prices for that period. Adjustments can be made to candlesticks so they suit your trading style and needs. Candlestick patterns are used by some traders to highlight trading opportunities.
I'll post more about candlesticks late so make sure you follow me

Hi! I am a robot. I just upvoted you! I found similar content that readers might be interested in:
https://www.thebalance.com/learn-to-read-and-use-candlestick-charts-1031004