There's something to take note of in this drawdown from the 61.8% fib retracement level. Take a look at the Relative Strength Index (RSI)* at the bottom of the chart - the purple section - it tells us if an investment is oversold (low) or overbought (high). You will notice that BTC's price in this dip today appears to almost reach the same level as the dip on Feb 2nd does not have the same drastic dip in RSI.
So, what are we looking for?
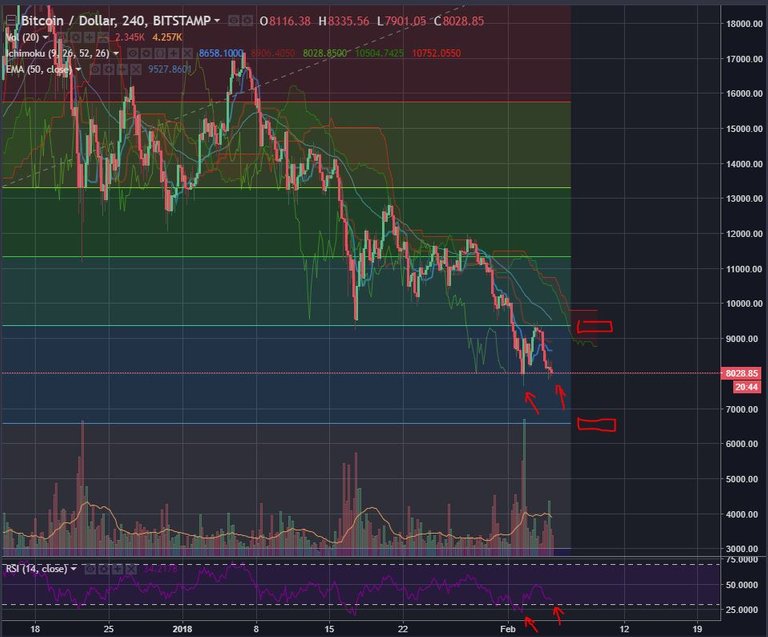
Look for BTC's price to make a lower low than Feb 2nd (go lower than $7600) AND look for the RSI to make a higher low then the level on Feb 2nd. If this dual-setup occurs then we are looking at a bullish divergence and may expect a short term bullish bounce.
However, my entry point is still set to $6500. I will be looking for that fib retracement level to provide support. If I see that it is providing support, then I'm long on BTC. If BTC's price goes up instead and breaks the 61.8% fib retracement @ $9400, then I will be looking to see if price action is occurring above the cloud. Then looking for a dip and possible entry if a bullish trend has been established.
Update to previous post..
https://steemit.com/bitcoin/@jagr/btcusd-technical-analysis-update-usd7995-feb-4th-2018