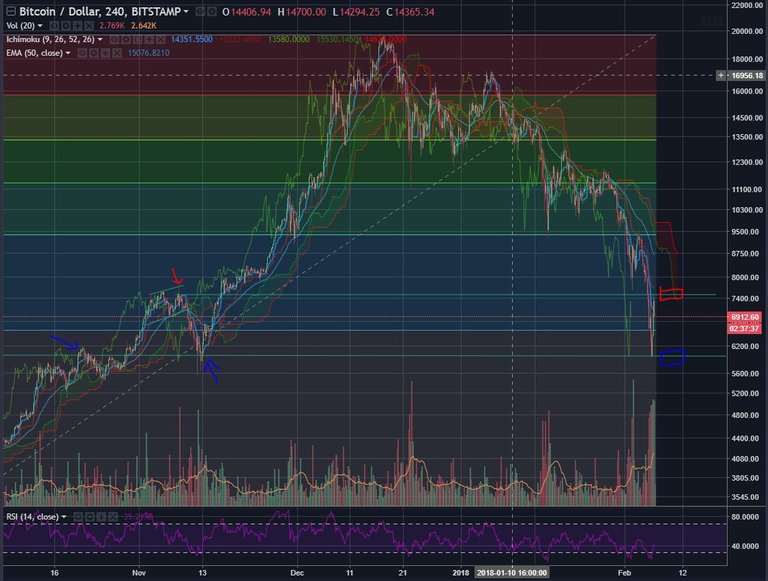
Just a quick update to: https://steemit.com/bitcoin/@jagr/btcusd-technical-analysis-update-usd6170-feb-5th-2018
So, it looks like a zone of support (see blue indicators on image below) has held up for now (plus our 78.6% fib retracement was just tested and held up - bottom of that 'blue' zone). This is just a quick update, so I'm going to tell you what I'm looking for. Since, I'm not entirely bullish on BTC just yet, I want to see a test of that blue support zone and a bounce before I look to enter into a BTC position. Or, I want to see a break of the red resistance zone and a pullback to that level (in hopes it bounces off the level - i.e. turning that resistance into support.)

Thanks for the analysis.
Hopefully BTC can find some support here. It's interesting how BTC and US indicies have moved the same way the last week and a half. Points to buying of USD as the driving force for the drop. Since the USD is overbought atm there is hope for a retracement ino.
Good point! I should have been thinking about that. There's a lot of USD floating around there now. Hopefully, some of it finds its way into this market.