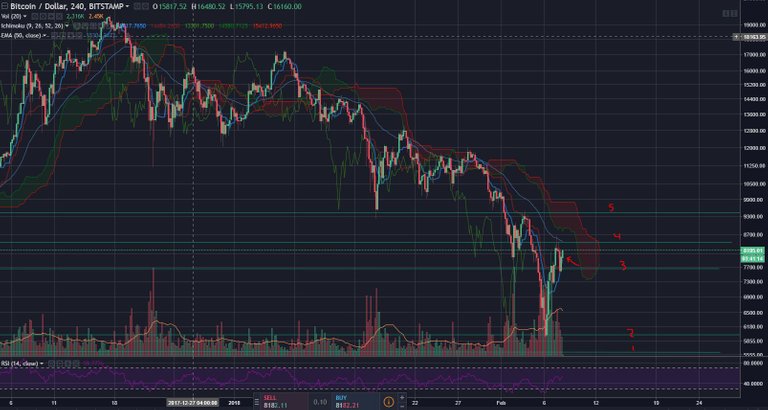
In my previous post https://steemit.com/bitcoin/@jagr/btcusd-technical-analysis-update-usd7779-feb-7th-2018 I was looking for bullish confirmation after the bounce of the S/R 3 zone and red Kijun line. Well BTC provided some bullish confirmation in the form of those to latest green candles you see by my red arrow.
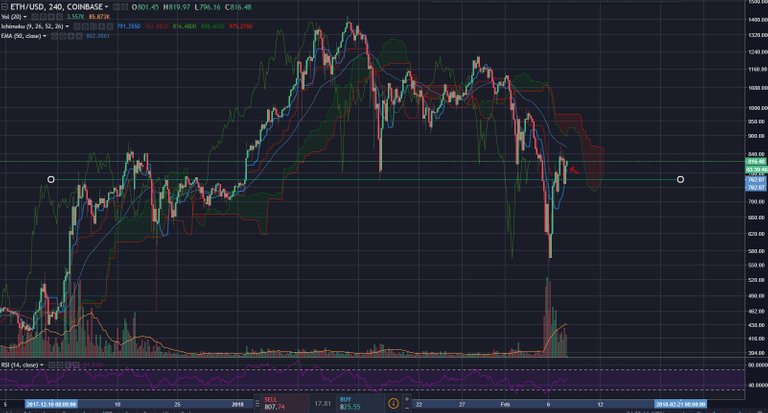
So, since I'm using BTC as an indicator of the market, I went over to my ETH chart to make sure i was good to enter in a trade. Looking at ETH, the same thing is going on. Bullish candle after bouncing off Kijun line.
And look at that horizontal S/R level on ETH. That's what I'm looking for. We broke through the S/R level upwards, dipped down to it and then confirmed a bounce off. So, I've entered in my ETH trade. Mind you, it's not much, cause I'm still waiting for possible drawdowns and better discounts. But, I may take some quick profits with this (or just my principal).
Note that this is not financial advice. This is just my own trade blog & journal. It keeps me in line.
Thanks @adsactly

