Hello guys, in this post I just want to illustrate what I believe to be the long-term, medium-term and short-term trends for Bitcoin and therefore what we could possibly expect in the future for the price of BTC/USD.
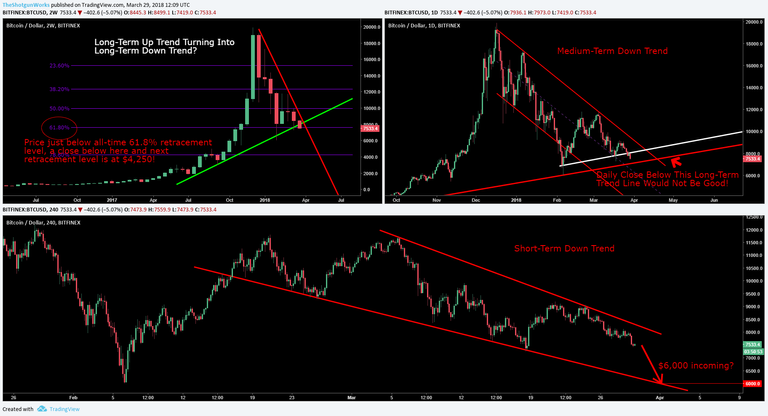
So here are my 2-Weekly (Long-Term view), Daily (Medium-Term view) and 4-Hourly (Short-Term view) charts for BTC/USD (Bitfinex):

As you can see I am very bearish right now and if we close below the 61.8% all-time fibonacci retracement level of the long-term bull move on even the weekly chart then we could be in for a bit of chaos.
Another possible confirmation of the medium-term (and possibly long-term now) down-trend continuing is if the daily chart goes down and closes below the long-term support line I have drawn on the top right chart. This support line has been drawn from July 2017 and so a break and close below this would put the longer-term uptrend in some serious doubt.
The final chart I have included in the image above is the 4-Hourly chart and as you can see we seem to be in a down-trending channel on this chart as well and if so this could provide us with a move down to $6,000 before we even have a decent bounce upwards.
Overall I won't be taking any long-trades for BTC/USD because to me the long-term uptrend is even in doubt now and I don't counter-trend trade. Mostly I will be looking for Bearish Divergence on Momentum indicators when we do see short-term moves up to sell into.
Let me know what you think and as always, thank you for reading! :)
Legal Disclaimer: This is just my analysis and not to be taken as professional financial advice. Do your own research beyond what you read in my blog posts and make your own decisions based on your beliefs about what to invest your money in.

I think you are most probably right - 6K is on the way. Then - maybe even lower. Thank you for the analysis.