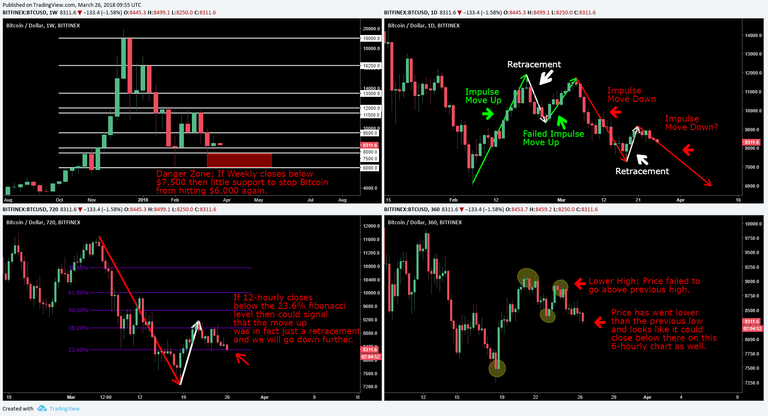
Hello guys so I have been working on improving my ability to use Multiple Time Frames to analyse Bitcoin and here is what I have come up with in terms of a possible Bearish perspective:

On the Weekly Chart (top left) you can see that I believe if we close below $7,500 on this time frame then there is really not much to stop us from hitting $6,000 again (or go even lower).
On the Daily Chart (top right) I have labelled each wave of price movement based on whether I believe each to be an impulsive move (a move with the overall trend) or a retracement (a move against the overall trend). You can see that I believe we failed the overall up-trend at around the $11,700 price area on the 5th of March and after that we moved back into an overall downtrend. I now believe that we have another impulsive move down on our hands.
On the 12 hourly-chart (bottom left) I have zoomed in on the recent impulsive move down and retracement waves to try to find evidence that the recent move up was infact just a retracement move. As I have shown in the image, if we close convincingly below the 23.6% fibonacci retracement level on the 12-hourly then I believe this confirms that the recent up move was in fact just a retracement within a now overall downwards trend. Another impulsive move down would then be expected.
Finally, on the bottom right chart I have the 6-hourly chart and I have labelled recent significant lows and highs to again try to determine if the move up was a retracement or not. The most recent high was lower than the high before that and so this is not a good sign for the bulls. Price has also went lower than the most recently established significant low and so I would expect a lower low to form some time in the near future as well.
That is all I wanted to show you guys in this post, hope you got something out of it and let me know in the comments below what you think! As always have a great day and keep grinding them charts :)
Legal Disclaimer: This is just my analysis and not to be taken as professional financial advice. Do your own research beyond what you read in my blog posts and make your own decisions based on your beliefs about what to invest your money in.

Thanks for sharing your analysis. I hope this drop will be the last and we will go up from there ☺️
Great! $6000 bottom and 14000 max. Thats it gonna be this year. I have to learn so much day trading...
Yes it could very well be a year to day trade the ups and downs in this market as usually after a mania happens and the bubble bursts price tends to go sideways in a range until excitement picks back up again :)
Normally after a bear market of 3-4 months we should experience a bounce and I think 15K around end of April-May is possible.
Thanks for the analysis!

I'd like to have your opinion about the below:
https://fr.tradingview.com/x/7xH4MwLA/
Broader view:

https://fr.tradingview.com/x/D13svQpb/
Looks like you've randomly thrown paint on a canvas lol
I wasn't expecting an art critique but anyway... I prefer referring to the facts. I guess that was luck, right? Well I must be a hell of a painter then with some kind of shamanic powers :)

https://www.tradingview.com/x/jZDOGj7b/
You drew like 15 lines and price hit one of them, lol. Anyways, let's not argue man I'll just put you on mute and we can go our seperate ways and be productive instead ;)
@investingtips, you're bad! You have been flagged!
Discount coins is what I read. I think it's time to stock up for me.
haha fair enough :D
Either that or do nothing, right?
Wololo!
(RandoHealer has healed this post because you have been randomly selected from the whitelist. Lucky!)