The Bitcoin bull run has been paused for 3 weeks now and a lot of people are comparing the charts to the start of the 2013 bear market. People are yelling "bubble popping" and posting this chart EVERYWHERE. 
I personally really hate this chart because the price action is so vague that this chart can be placed into almost any chart at some point... Big move up first, dip to a lower high and then a bigger leg down. <-- That always happens everywhere
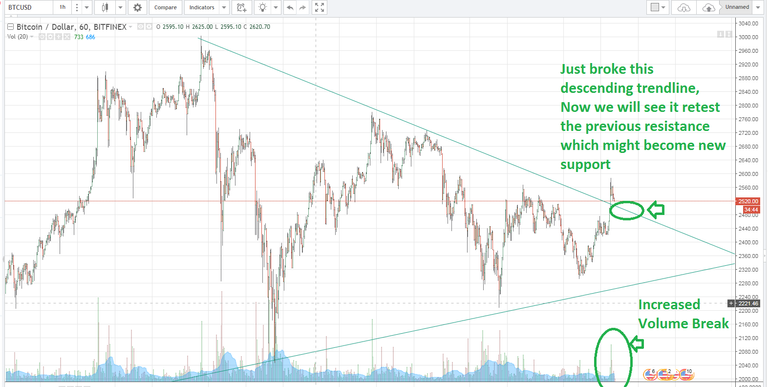
Anyways before saying this is all over and its going to be a long bear market, we'll have to see how this week turns out since it is the end of a 3 week symmetric triangle.
Symmetric triangles usually break in favor of the general trend which has been up. So far we are seeing that this is true in this bitcoin chart(All BTCUSD exchanges have the price breaking the down trend line, but I picked Bitfinex since it has the most volume out of the others).
The volume on this break is not really high, but I think this is due to the holiday weekend July 4th. If the downtrend line can act as support now and this starts to hold or head higher with more volume ( which will prob happen after the holiday) we should see this bull run continue and make another attempt at the 3k ATH. Let's see how this week plays out.
Please Upvote, Resteem and Follow me @ichoponions for more crypto news/trades.
Yeah...looks like it's approaching the end of the triangle in the next few days....hoping it goes up!
Yes I am hoping that as well and I also bought way more
The Gartner cycle seems to be aimed at hype cycle and not so much price.
I see. Appreciate the information! Then I'd like to add that in the hype cycle I do not think we are near capitulation/despair section that people seem to suggest =)
Not by a long shot.
Thanks for your best post upvote (y)
Appreciate the kind words.