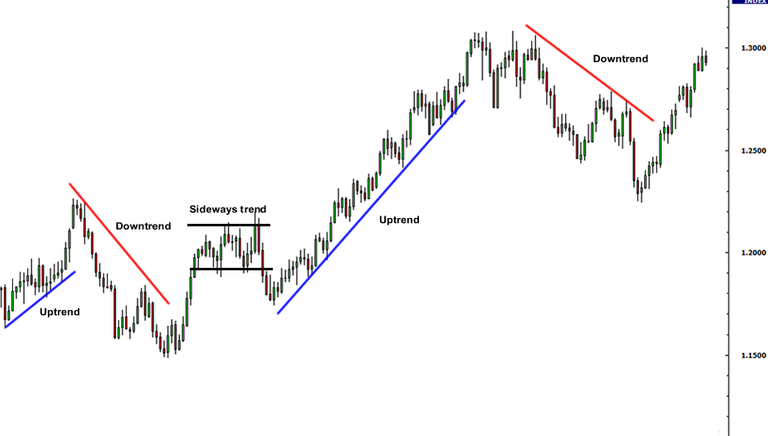
If you really want to make money by trading cryptos, you should study what trend lines and channels are, and, of course, how to draw them and use them to your advantage. Here's a brief overview.

Trend lines
Trend lines are the staple to any cryptotrader. No matter how simple they may look at first, they are an essential tool because they give us useful information about the current direction of the price based directly on the price. They don't need any sophisticated formula or manipulation like technical indicators do, we draw them ourselves based on what we see on the chart.
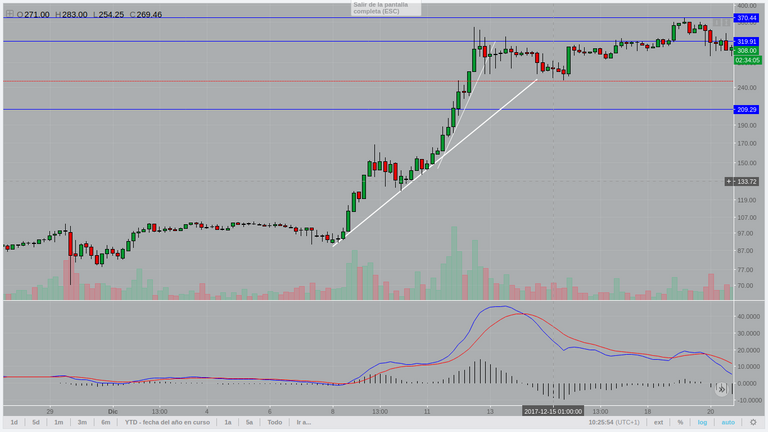
Technically speaking, a trend line serves as a support level for the minima in an uptrend and as a resistance level for the maxima in a down trend. Here's an example of a bullish trend line from the pair LTC/USD:

Remember when Litecoin almost doubled its price within less than 72 hours? Here's what happened. As you can see, we have two trend lines. The thicker one is the main trend line, and we should expect it to act as a support level for a given uptrend, but this doesn't happen as often as we would like. Sometimes the uptrend accelerates, which is what happened in this case; decelerates, or changes its direction altogether. The second trend line here, the thiner one, tells us that Litecoin at that very moment was going straight to the moon. However, it didn't last for too long. The more pronounced the slope of a trend line is, the sooner it will end, and viceversa. In fact, experts say that the healthiest trend lines have a slope of 45 degrees, but this ideal measure rarely happens in reality.
Channels
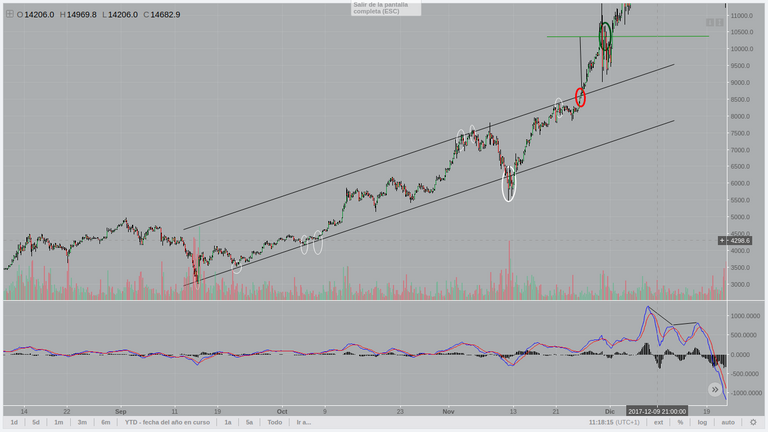
The next concept to learn right after trend lines is that of a channel, which is basically, two parallel trend lines that engulf the price. A channel, to be considered as such, must present at least 2 attacks to the top line and 2 to the bottom line, though the ideal would be 3. Look at this channel on the pair XBT/USD (Kraken):

I've circled in white the times when the price attacked the boundaries of the channel and then bounced back. Also, we have in red the breakout point, when the price finally managed to surpass the top resistance level of the channel. In this cases, we have a beautiful way to measure how much the price will rise or drop. See the green horizontal line right above the upper boundary of the channel? That's our target point, where we should close our bullish position. It is calculated by drawing a perpendicular line between the two boundaries of the channel, projecting it onto the breakout point, and then drawing a horizontal line right over it. In this case we reached it without any problem, but there was some volatility around that point.
Sometimes there are fake breakouts, in which the price goes back into the channel. This is a very common thing and we shouldn't feel frustrated when it happens. However, when the breakout is for real, there's a really high probability that the price will reach the target point.
Hyperion
Esto me hacia mucha falta. Me imagino, y disculpa lo básico de la pregunta, que estas hablando de las "lineas de comportamiento" de la moneda en paginas como Coinmarketcap?
Algo así. Hablo de lo que se conoce como líneas de tendencia y que puedes dibujar tú mismo en cualquier plataforma de trading :)