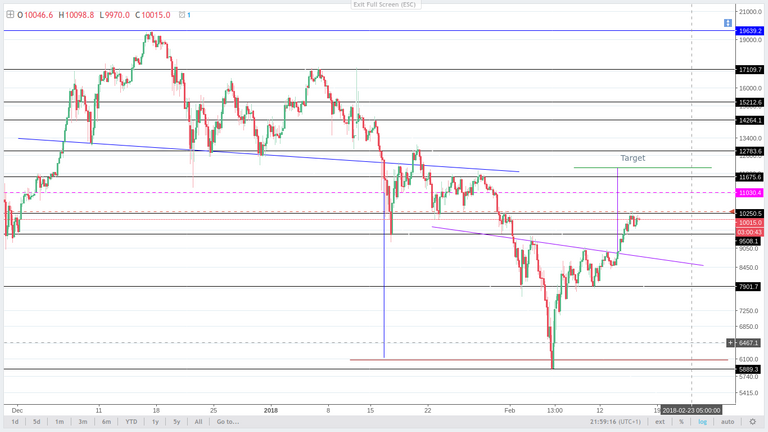
Here's the 4h chart for BTC/USD (XBT/USD on Kraken). We can see that right before the end of 2017 a shoulder-head-shoulder pattern (S-H-S) was formed. The breakout of its neckline (blue trend line ) didn't occur until January the 16th. After that, a new target price was set: $6000 (represented by the dark red trend line ). As you already know, the target was very well met on February the 2nd. The panic took over the market, but we soon saw the bulls wake up.
Now we have the opposite escenario: another S-H-S pattern, but this time, inverted. It might be an indicator of a trend reversal, since the price has already broken through the neckline (purple trend line ). We have set, therefore, another target price at around $12k. However, there's an important resistance level at around $11,600, so it may be a good idea to close our positions as soon as the price hits that level. After that, we can rebuy the bounce and try to break through the resistance with much more momentum.
Hyperion
Wow.....I resteem..good luck
Thank you!
Congratulations @hyperion! You have received a personal award!
Click on the badge to view your Board of Honor.
Do not miss the last post from @steemitboard!
Participate in the SteemitBoard World Cup Contest!
Collect World Cup badges and win free SBD
Support the Gold Sponsors of the contest: @good-karma and @lukestokes
Congratulations @hyperion! You received a personal award!
You can view your badges on your Steem Board and compare to others on the Steem Ranking
Vote for @Steemitboard as a witness to get one more award and increased upvotes!