Hello there steemians!
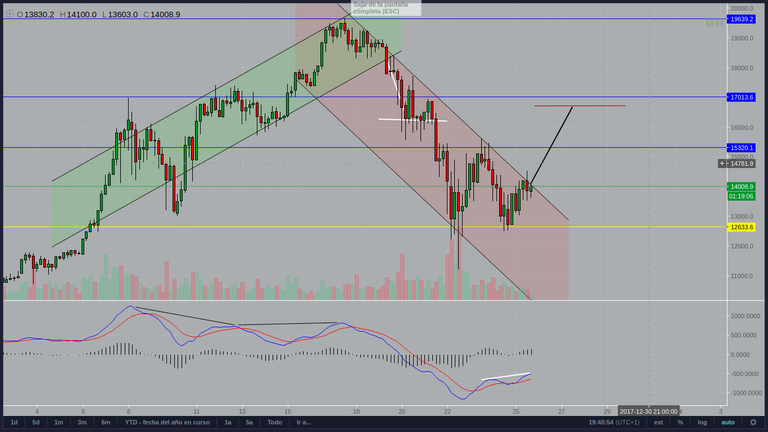
As you can see, bitcoin price has recently broken its last uptrend (the green channel), and it's now on its way down through a bearish channel (the one in red). This downtrend has caused the price to fall nearly a 40%, but we have some pretty good indicators that it is losing strength and might soon be broken. The main signal for this is is the MACD divergence.

I want you to look at the MACD while we were on the uptrend. On december the 8th, the price reached a maximum (17k) and it was pertinently shown on the MACD, whose blue line reached a maximum too. On december the 13th, we had another maximum right above 17k. We would then expect the MACD blue line to be above the one we had the 8th, however, it is below! We then have a divergence between the price and the MACD. Whereas the price is registering higher highs, the MACD blue line presents now a lower high. This means the trend is losing strength and will soon be broken. Now look at the chart right before the 18th. The price reached an all-time high of 20k, but the MACD didn't even reach the level it had reached the 8th. We then have another divergence between the price, and the MACD blue line. This gives us even more reasons to believe the uptrend is going to end soon. And so it did.
Right after the 18th, the price broke the bullish channel and started the current downtrend. Now look at the MACD again. Around the 23th there was a bounce in the price, and so the MACD blue line rose. Then the price fell again and the blue line dropped too. From yesterday till the current moment, we have had another bounce in the price, but is hasn't been as strong as the preceding one, that is to say, we have a lower high so far. However, the MACD blue line presents a higher high (marked with the white trend line). This is, ladies and gentlemen, another divergence, which tell us the downtrend is capitulating.
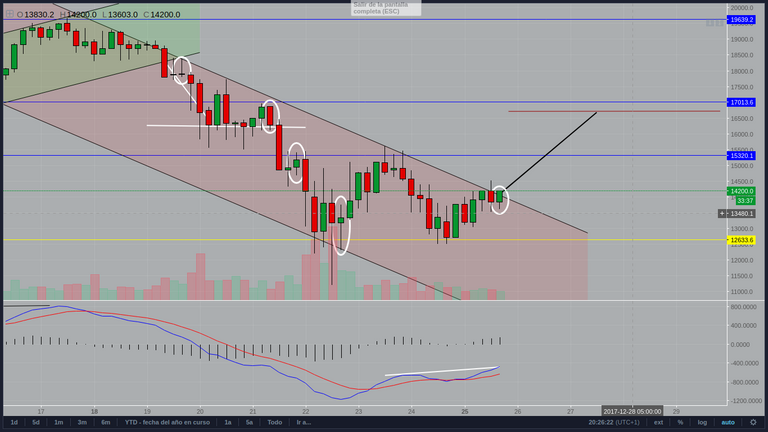
Let's zoom in a little bit to see what's going on.

Take a look at the candlesticks that I've circled in white. These are called inside bars. They all fit within the range of the previous candlestick, which we call mother bar. They are a great signal to tell us there's going to be either a marked drop or a rise in the price. Look again at the chart and you'll realise how this is true. With the inside bars alone we wouldn't be able to determine if it's going to follow a drop or a rise, but with the MACD divergence, we have a solid reason to believe it is a good moment to enter the market.
Taking into account the width of the downtrend channel and drawing a perpendicular line (in black), we can determine how much the price is going to rise (the red horizontal trend line). We can conclude that, if the breakout really takes place, which seems reasonable, we are going to have a rise of more than 15%. We now lie at around $14,150, and we expect it to reach the horizontal red line at $16,700 in the next few days.
All in all, I think we are going to break the downtrend within the next 24 hours and reach a new high within the 16-17k range in the next few days.
Hyperion
Bonjour, quel superbe article, il est très bien détaillé, ça à dû vous prendre beaucoup temps, pas vrai ?
Vous méritez d'être plus populaires sur la plateforme steemit, car votre travail fourni et passionnant et très impressionnant ;)
Ravie de vous connaître, mon nouveau ami.
J'espère que tu pourras aller voir mon contenu sur mon blog ;) et tu donne ton avis, ok ?
https://steemit.com/@katouna
Bonne journée ;)
I think you could be right. The price rebounded strongly and there seems to be enough bullishness left to try a new ATH run soon. But that could take 2-3 months of regrouping below $20k. Meanwhile the Alts are also holding very nicely.
2018 promises to be an exciting year.
Yeah, I didn't say there's going to be a new ATH, but rather a new high within the 16-17k range.