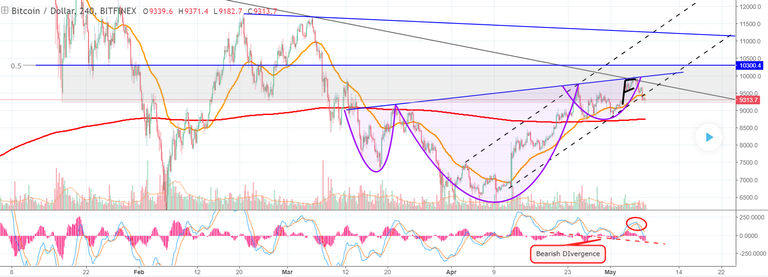
Hi friends! Welcome to this update analysis on Bitcoin! Let's get it! Looking at the four hour chart, you can see that BTC -0.38% was rejected by the neckline of the head and shoulders pattern, as it converged with the falling black trendline resistance. If you're one of the few people who actually read my analyses, instead of reading only the titles and glancing at the charts, you'll know that I gave very fair warning to a potential reversal on my last post. In that post, I said "As you can see, #BTC -0.38% is building a bull flag inside of the right shoulder, just below the neckline of the inverse. So, that's a pretty bullish looking setup. With that said, nothing is guaranteed in this game. Yes, it's an inverse head and shoulders , but that doesn't mean that we will see a breakout. Patterns fail to breakout all the time, so (for educational purposes) the best way to trade the various TA formations, is generally to wait for a confirmed breakout."
The breakout never materialized, and instead BTC -0.38% was rejected at the #neckline (which was a technical sell signal) and has fallen below the bull flag , and below the uptrend channel . The current candle is actually printing a positive reaction off of the bottom of my grey zone. If you recall from a few posts ago, I defined the grey shaded zone as an area that has #historically been plagued by #powerful reversals. With that said, if BTC -0.38% breaks down below the grey level, we could see another test of the 1200 EMA (in red.)
Regarding the upside targets, they simply aren't valid without an upside breakout from the inverse head and shoudlers pattern, and that's something that I explaind in the previous analysis. In it, I said "In terms of my targets, the first target AFTER THE BREAKOUT is at 10300. From there, assuming that we do breakout, I would imagine that BTC -0.38% could continue to trade higher inside of the black dashed uptrend channel , until it hits the second resistance around 11200. Depending on what happens there, and IF THIS PATTERN PRODUCES A BREAKOUT AT ALL, there is a technical possibility that we could reach the 38.2% retrace, at about 12500, in the very near future. With that said, you have to understand that these analyses are CONDITIONAL. That means that XY and Z must occur for the targets to be reached. So don't look at the 12500 target, and then come back in a few weeks to tell me that I was wrong, if 12500 isn't reached. If the conditions aren't met, then the #analysis could change." The inverse didn't even break out, so the targets were never validated.
On the MACD , you can see that the bearish divergence continues to build, showing an increase in the slowdown of buy-side momentum. The consistent increase in the bearish divergence, coupled with the apparent failed breakout of the inverse head and shoulders pattern, could be a precursor to further downside. A confirmation below the 1200 EMA (in red) would be an #extremely bearish development on this market, and we aren't that far above it at this point. If that happens, my old #downside #targets of 6K, and potentially 3-4K would be right back on the table. On the other hand, If we get back into the uptrend channel , that would put a retest of the neckline in play.
I'm the master of the charts, the #professor , the legend, the king, and I go by the name of Magic! Au revoir.
This information is not a recommendation to buy or sell. It is to be used for educational purposes only.
-H you-
.png](https://images.hive.blog/768x0/https://steemitimages.com/DQmUVYtvYFfwoqXb8xNBqQETjJtfdAFpWKaLKdCgBokWWKY/%EB%B9%84%ED%8A%B8%EC%BD%94%EC%9D%B8%20%EA%B3%B5%EB%A7%A4%EB%8F%84%20%EC%97%AC%EA%B8%B0%EC%84%9C%20%ED%95%B4%EC%95%BC%ED%95%98%EB%8A%94%EC%9D%B4%EC%9C%A0%203%EA%B0%80%EC%A7%80%20(4).png) )
)
click to move to #futurestrading : https://goo.gl/cT6Z9n
Hi! I am a robot. I just upvoted you! I found similar content that readers might be interested in:
https://www.tradingview.com/chart/BTCUSD/xVlyzSXn-Wanna-Know-What-My-Analysis-is-About-Read-it-Bitcoin-BTC/