I know Haejin is busy. Is there someone savvy in the wave count that can explain why #3 in the USD chart is not at the spike before.
Is it because the bottom of that spike dips below the #1 peak, and therefore it can't be the #3?
I know Haejin is busy. Is there someone savvy in the wave count that can explain why #3 in the USD chart is not at the spike before.
Is it because the bottom of that spike dips below the #1 peak, and therefore it can't be the #3?
bingo!
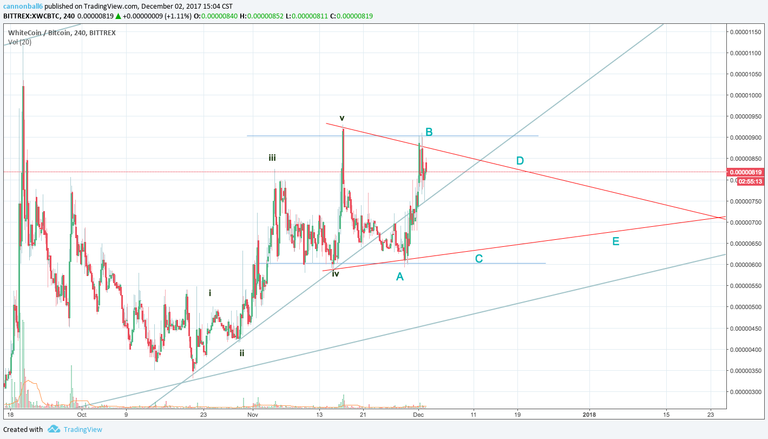
Hi Haejin, on the XWC/BTC chart, do you think it is more likely to correct as a horizontal channel (blue channel lines in the chart) or a triangle (red lines):
Or is it more likely a simple abc (not shown) with a lower low (below 600 satoshis). Thanks!
Agreed
Thanks !
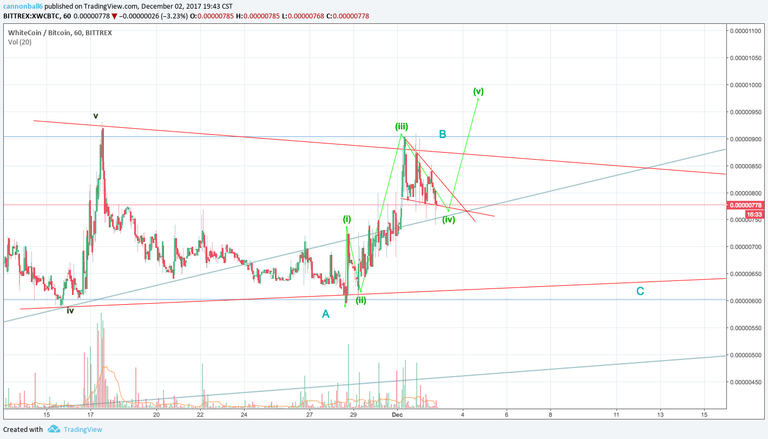
Or on the one hour: ?
?
Just sold out and took my profits! Thank you again kind sir! Planning on obtain few XWC more for the same money at the terminal end of the ABC, then taking the left over profits for more BTC and BTS!