What looks like an extremely bullish signal is actually saying: end station. We will give you much opportunity to enter and exit here. This train will not be going anywhere until January.
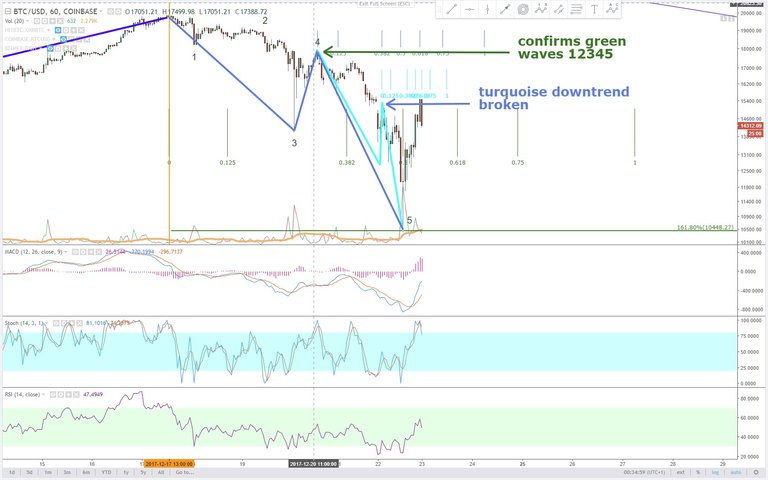
On the hourly chart the price has broken the downward turquoise trend, marked by the lightblue arrow. Because of that it is known that a lightblue trend section has ended.
When the price rises above the green arrow next, this will just confirm the projected green waves 12345. They could have been assumed like that yesterday already. Astonishing how precise the price fullfilled the 1.618 times distance until wave 3 for completing wave 5.
So this is bullish for now on the hourly chart.
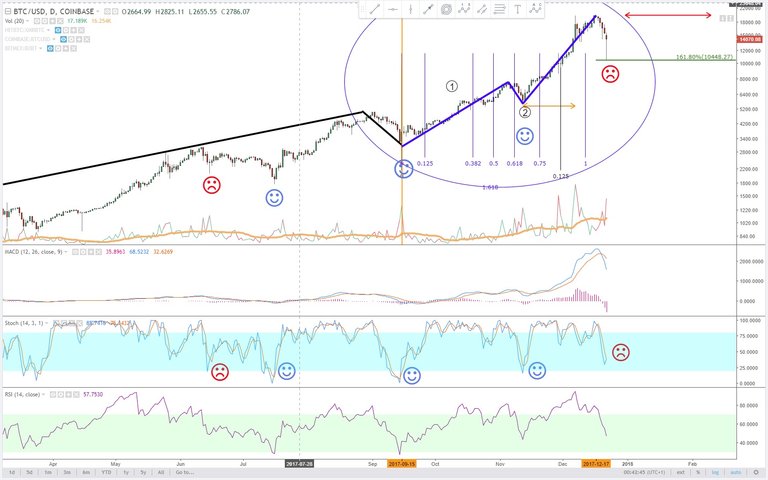
The daily chart looks promising at first glance because the last candle could develop into a candlestick formation called hammer. The most bullish signal there is.
Unfortunately the stochastic did not fall below 20.
Take a look at the smileys and see what happened after the stochastic fell below 20 noticably. And what happened when it failed to do so.
This regression is not over.


Very interesting, so according to your experience what is it that will happen? How low will it hit. Not asking for investment advice, just for your oppinion.
If the stochastic of BTC goes up in the next days, the regression will not be over until the middle of January.
If it falls even further in the next days, the regression will be over in December already.
BTC falling to 9366 on this chart would be normal actually. That would be the 0.618 Fibonacci retracement level.
Looking back the last 4 months, how good were your prediction in you honest opinion?
They failed often. They were accurate often. Thats why i use stops.