
SUMMARY
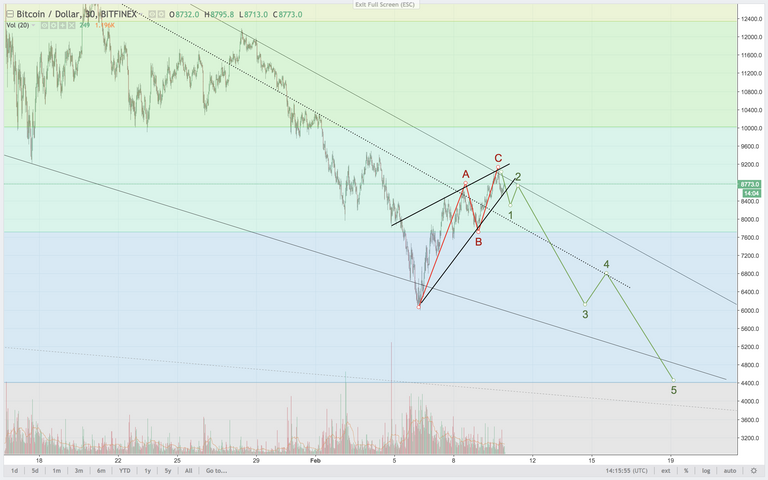
The evening update had shown a upward pointing wedge and a minor correction was projected. Overnight price action has declined a bit and likely placing an abc retracement wave.
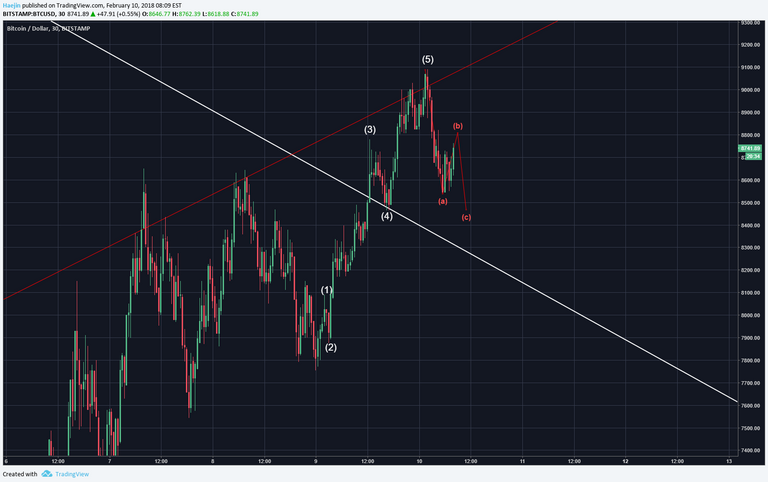
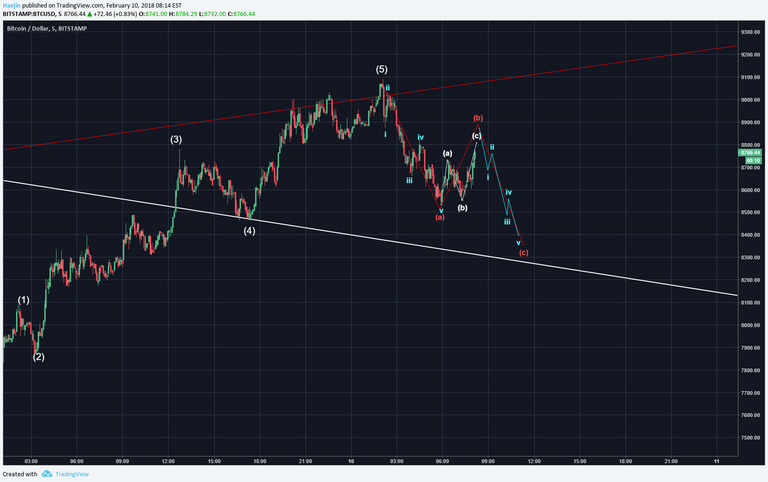
The abc is probably a ZigZag where already five subwaves of the wave A is identifiable and the abc subwaves of the red B as well. The red C wave will consist of five subwaves. It's likely that price will return to the upper white line of the wedge and sit on it as support before resuming upwards. That support line needs to hold and any decisive breach downwards would imply other waves and patterns.
The wedge outlined in blue could be a fractal of the white wedge. The first had an abc and price resumed upwards. The current wedge is also doing that abc retracement and likely will resume upwards.
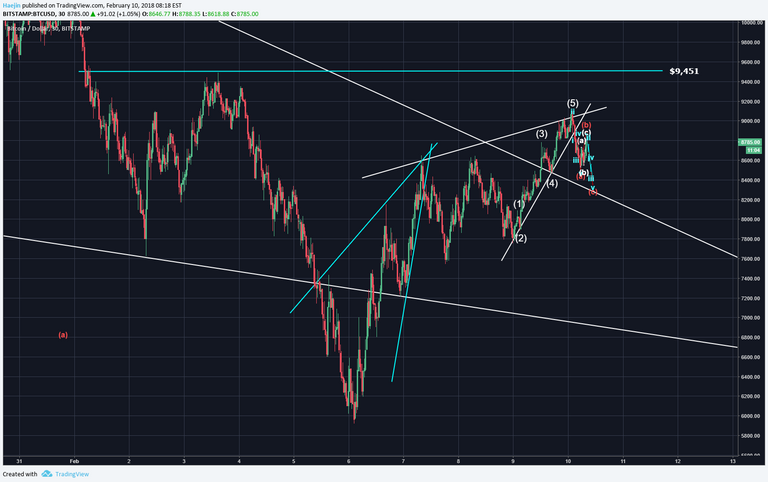
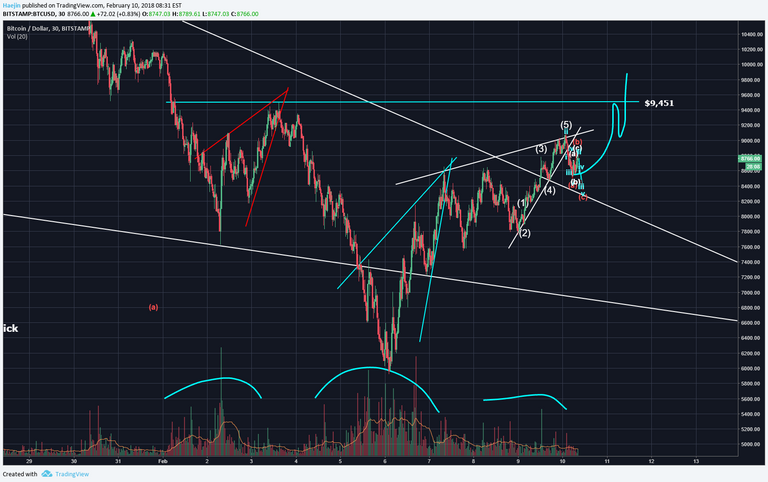
The Head & Shoulders pattern completion would mean that price needs to breach the upper $9,451. That would then confirm the pattern. Volume is not perfect in confirmation since one Left SHoulder peak is higher than the highest volume peak in the Head; however, overall, the volume patterns very well.
Legal Disclaimer: This is only my opinion, make of it what you wish. What does this mean? It means it's not advice nor recommendation to either buy or sell anything! It's only meant for use as informative or entertainment purposes.
Please consider reviewing these Tutorials on:
Elliott Wave Counting Tutorial #1
Elliott Wave Counting Tutorial #2
Elliott Wave Counting Tutorial #3
Laddering and Buy/Sell Setups.
Laddering Example with EOS
Tutorial on the use of Fibonacci & Elliott Waves
@haejin's Trading Nuggets
Essay: Is Technical Analysis a Quantum Event?
Follow me on Twitter for Real Time Alerts!!
Follow me on StockTwits for UpDates!!
--
--

If this blog post has entertained or helped you to profit, please follow, upvote, resteem and/or consider buying me a beer:
BTC Wallet - 1HMFpq4tC7a2acpjD45hCT4WqPNHXcqpof
ETH Wallet - 0x1Ab87962dD59BBfFe33819772C950F0B38554030
LTC Wallet - LecCNCzkt4vjVq2i3bgYiebmr9GbYo6FQf
BTC/USD
Not sure if this is going to happen, but I wouldn't say no to another chance to pick up more at rock bottom prices!
I was seeing the same wedge you identify for forming your ABC and asking why not...
I believe the the c is too short. The wedge decline would be limited.
Good to see it trending up. As long as we see volatility in the stock markets, that should be great for cryptos.
I haven't actually seen this correlation. In fact, there was famous published last year that said the crypto market is an uncorrelated asset class and can lead to a reduction in volatility if included in your overall investment portfolio.
Your posts are always informative. I know you get heat from some about abusing power as a whale, but I see that in sharing your insight you are contributing greatly to the community. Thank you, and keep it up!
He’s not a fucking whale you moron. He just gets his vote from a whale. He’s some nobody making up bullsht that is wrong 90% of the time and lucky the other 10%. Flagged for being the slow kid.
@berniesanders I feel overwhelmed and in awe that I was flagged by you. I'm not even being sarcastic. I do think that you could make your point better if you cut down on the personal attacks, though. I would love to see you make a post that would calmly explain your vision for this platform what stayed away from the attacks. I think yours is a voice that carries weight and deserves to be heard.
Nope, doesn’t work. Sorry and good luck.
Good morning, and I do appreciate the steemit lessons you offer.
You got game theory.
I'm vote you
why all the hate... if you do not like his content then just move on..
To think ppl think haejin doesn't care, yet I don't know any person who gives trading advice, and so many updates during this time in the market. Clearly because he knows it helps stop fud. Thanks @haejin for keeping us up to date.
How are doing. I just vote you
That is a very nice informative post,where you shown everything in detail's.I always follow your calculation and most of the time you are spot on,Lets hope that soon the market will be totally ok.Thanks to you@haejin sir for such useful post.@upvoted and resteemed.
saraalkaf?
How are doing. But I'm just vote you
thank you haejin, but one question, if price go up again, towards 9.450, will that confirm bullish or will we still need more confirmation?
hey @haejin, i think i have a temporary workaround for your mouse issue.
In the browser, hit F12 to open the developer tools panel. In that panel, select the 'console' tab and paste this in and hit enter:
$('td.chart-markup-table.pane')[0].setAttribute("style", "cursor:none");
you can then close the developer tools panel with F12 again. this will hide your mouse cursor whenever its hovered over the candlestick chart panel and you can just use the crosshairs. The effect will go away if you refresh the page or close the browser tab. This code will also only work on tradingview.
I hope this helps you like you've helped us and i wish you MASSIVE profits!!!
If the C wave of this correction goes below the five wave of last impulse isn t that bad?
is very interesting this great debate that leave us for this publication ,,, we will get the most out of it ,,,, my most sincere opinion on the most important issue is about the currency ,,, which is believed to have the greatest rise of the story ,,, the bitcoin will pass its value reached in times ago ,,,,
Thank you for sharing your morning BTC analysis this morning.
isn't the retracement of wave 5 from wave 1-3 towards 7150-7800?
How about the simplest answer is the most likely explanation? This recent 6000-9000$ run-up might be a wave 4 of an impulse. It fits a clasic 5-3-5 zig-zag pattern. you also don't need to strech the wedge at all to fit the pattern and it is way closer to the apex (given timelaps and the fact that corrections are slower, it's right on the apex) , MACD also seems to confirm it. You keep beeing bulish al thru this correction, already called 2-3 times a possible bottom . At one point you are going to be right but it might be usefull to show your audiance an alternative view. It never hurts.
Your wave 2 is too low and needs to be higher. IF so, you'll also be able to count the remaining 3,4,5.
Wave 2 is lower, i just didn't bother to count it precisley that far in the past..png) Ps: don't take it the wrong way i apreciate your work and look forward to it, even when it's wrong (and most of the time it's right) it still gives me a different usefull perspective.
Ps: don't take it the wrong way i apreciate your work and look forward to it, even when it's wrong (and most of the time it's right) it still gives me a different usefull perspective.
He has in past videos just a few days ago and said we may have another low...but for now the primary count is up until proven otherwise :-)
Look at the price action so far, it's why you nead to offer alternative reads.
Yes? No?
I believe that'll be too low. BOunce to happen earlier.
I'm vote you
follow and vote muktariza011095
https://steemit.com/bitcoin/@blockchain-group/british-entrepreneurs-sold-50-luxury-flats-in-dubai-for-bitcoin
EXCELLENT INFORMATION, VERY WELL, I CONGRATULATE YOU
အိုလမို
@Philakone thinks this way, what do you guys see, what is more likely?
Your wedge isn’t accurate. Even though it broke above resistance earlier, it still came down and you have to measure from the highest point
absolutely right. But Haejin's being bullish as often...


Bigger picture:
Here's my view of the current situation.. green line is the resistance mentioned in @Philakone's chart.. upper red is another major resistance.. Now, looking at the MACD and BB, price should be able to reach $9,1k-$9,2k.. That would, in my count be the E wave of the bearish wedge (white).. I believe that's when the price will reverse, but in my mind, only to around $7k, which is the lower line of the 2 month big bullish wedge.
Yes, this scenario has got me worried @haejin what do you think?
Haejin, always appreciate your input. Don't get me wrong, as I always do my own research and when it comes to charting, I like to mash together various opinions to draw my own, but does anyone else feel like the markets moved more freely while Binance was down? Sometimes I wonder just how bad is the price manipulation, and is Binance "a" or "the" major player in that manipulation process. TRX is the perfect example here, as it was set free until Binance reopened. Anyhow, thanks, as always.
Trading is far too thin to be a useful indication of anything. And until volume increases, prices will remain highly vulnerable to gaming.
The major exchanges and trading platforms are all amateur hour, and most have perverse incentives to front run which can tilt prices even more dramatically. Market manipulation is rampant and structurally impossible to solve short of mass action or outside regulation.
My charts show that we have not yet broken out of our long time descending wedge (BITSTAMP data) that has held us since prior to Christmas, although we are about to do so in the next few hours. Once we do we should climb fairly quickly to 11k. Some resistance at 9.6k along the way (maybe a good place for a quick $500+ trade), but then continued upwards ascent. 12.6k will be our true test.
Related Post: https://steemit.com/bitcoin/@stew/i-think-we-ve-hit-our-low
Thanks for giving updates about the bitcoin