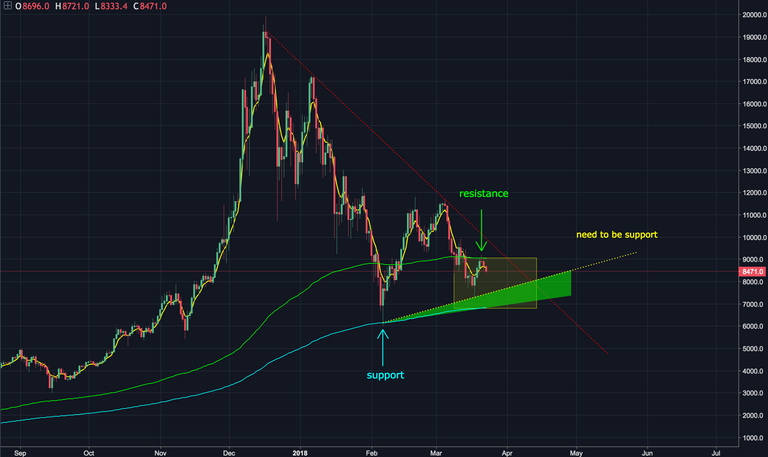
I think that BTC is now trapped between EMA (200) and (400). The EMA (200) served as a resistance line and the EMA (400) served as a support line. The EMA lines are almost parallel, and it indicating that the BTC is trapped a flat pattern. From this perspective, I have summarized the issues that I think are important at this point.

#1. In a recent price action of BTC the price have declined due to take resistance at the EMA(200) line. It means the anxiety about the market is still not recovering. If the price stays near the EMA(200), the decline may continue in the long term. To successfully break through the downtrend, BTC price must be breach out the EMA(200) and use this line as a support.
#2. From the past $ 6000 points, we have confirmed the strong support of the EMA (400) line. Unless Bitcoin prices collapse, this line will be kept firmly. If this line collapses, the bitcoin will fall into the dark age like in 2014.
#3. Bitcoin is more likely to be trapped between the EMA (200) and (400), if there is no news to change the current trend.
#4. The green triangle shows that the low price of the bitcoin is gradually moving away from the EMA (400). This suggests that buying sentiment is recovering slowly. At the very least, this triangle should not collapse in order for the bitcoin to show a clear uptrend in the near future.
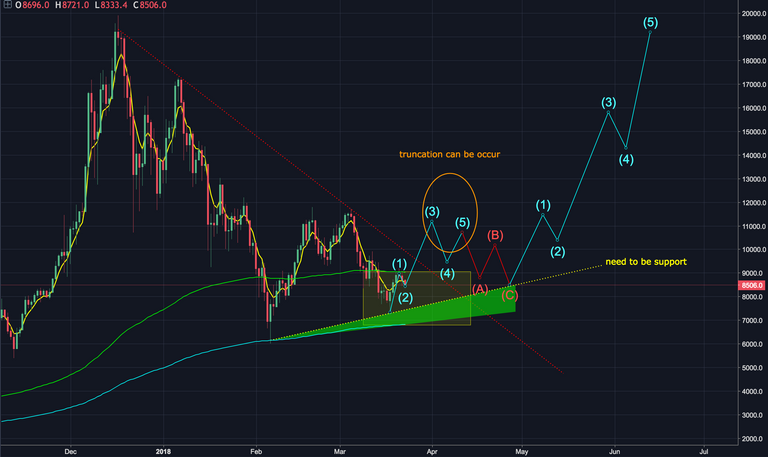
I do not think bitcoin is going to collapse, so I attached the scenario below which I think is most likely at this point.

The rise will not happen at one time. It will be closer to the '# 2 Moving target to the' e 'point' which was covered in the previous posting (Bitcoin (BTC) Update: Two positive scenarios!). As you can see from the orange circle on the chart, there is a high probability that the price will have 'truncation' as it moves. BTC prices will seems like moving in a flat for a long time. It will be quite boring but, BTC will gather a strength for the rising within the flat moving.
- If you get any help from this posting, press 'UPVOTE'!