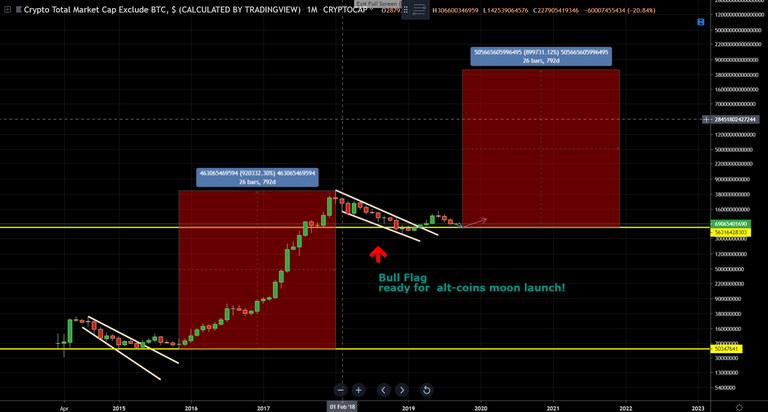
Analyzing the crypto-currency total market cap excluding BTC on trading view, we can see clearly on the monthly view that alt-coins are about to repeat a pattern that lead to a massive rally. This pattern called a “Bull Flag” is a very bullish pattern especially the further you zoom out, in this case the monthly chart. As clearly seen in the chart bellow, a very bullish case for alt coins is about to begin. Notice this pattern is to the day repeating itself exactly as it happened after the last bear market. A small rally , a correction, and then a boom to the upside that lasted two years peaking with massive 920,332% gains. We all know that in this crypto-currency space anything can happen, what I’m showing is simply the bullish case for alt-coins since the sentiment for holding alt-coins is at a all time low.
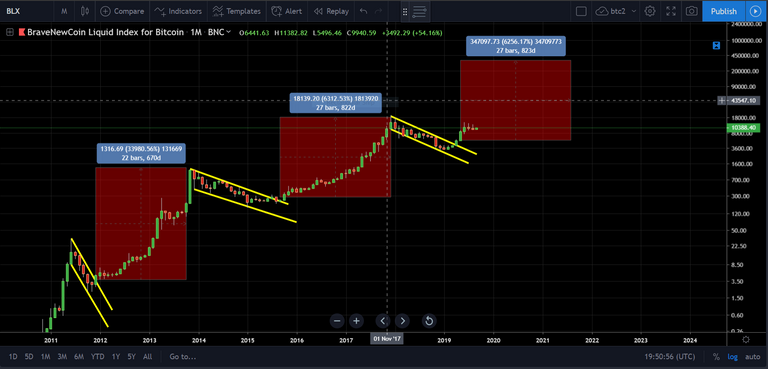
So as of now expect a further correction to at least the yellow support line to accumulate because after takeoff there is no looking back. If the past is any indication expect another month and a half of accumulation before the massive alt-coin season to begin. No one knows where this bull market will peak, but if the previous is any indication than just remember that from the bottom to the peak was a massive 920,332% gain. I’m not saying this is a guarantee, I’m just looking at the data in the chart and seeing what is possible. Bitcoin also repeated this pattern 3 times, but the chart bellow shows two of the three bull markets. What amazes me is the action that follows a bull flag on the monthly chart and based on previous data I feel that it is worth the risk to add to my positions and to see what happens. As a hodler from 2017 you know I’m deep in red but if based on pure data leaving emotions to the side I think riding this out a little bit longer will pay off in the end.
I’m not a financial adviser I’m far from it, actually I specialize in losing money in crypto, but I’ve learned a lot the hard way. Learning technical analysis sure helps out trying to predict price movement and what I’m doing is just sharing what I believe to be valuable information. I hope you find this information helpful.
The above picture is the total market cap excluding BTC showing the bull flag pattern.
The above graph shows what happened to bitcoin after exiting a bull flag. Note the percentage gains and what is possible in time if the pastern repeats itself.
So to conclude expect the bull market to peak around the end of 2021 before the next bear market to start, that is if all continues on the current path and history repeats itself in a similar way.

