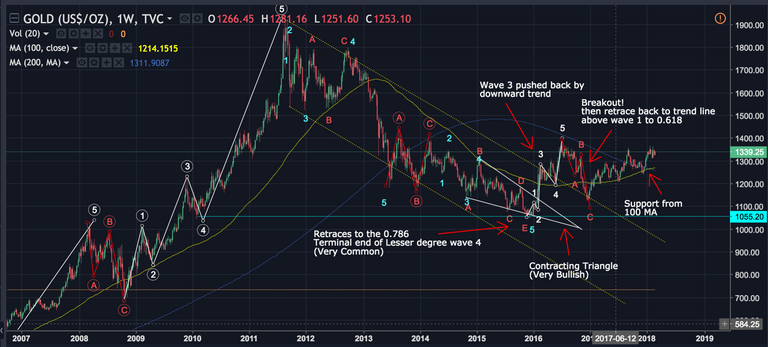
Figure 1 - GOLD/USD (Weekly Chart)
The Technical Analysis of the Gold chart is based on events that have already occurred from the 2009 to 2018 period. I have highlighted all the key points:
- Retraces to the 0.786. i.e., Terminal end of Lesser degree wave 4
- The Contracting Triangle before it broke out with a motive impulse
- How the Wave 3 was pushed back by the Downward Trend (Yellow lines)
- The Breakout of the Downward Trend and then retrace back to trend line above wave 1 to 0.618 fib
Now check out the 4-hourly chart of Bitcoin to the US Dollar.

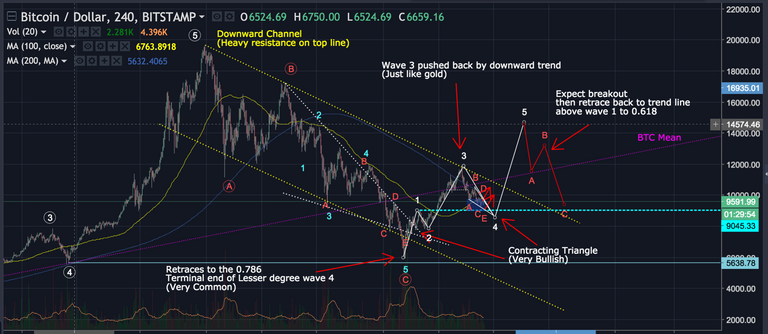
Figure 2 - BTC/USD (4 Hour Chart)
One thing to remember is that Bitcoin is a much smaller market cap to gold, so it moves in a shorter time frame. You'll notice the striking similarity of coincidences that have already occurred.
- Retraces to the 0.786. i.e., Terminal end of Lesser degree wave 4
- The Contracting Triangle before it broke out with a motive impulse
- How the Wave 3 was pushed back by the Downward Trend (Yellow lines)
But there is only the last point remaining...4. The Breakout of the Downward Trend!
Are we on the cusp of seeing Bitcoin break the downward correction and enter a new era of upswing for 2018?
And if so, is Bitcoin the new Digital Gold in more way then just a store of value?
Not long to go before we find out.
-FB
Congratulations @foobarme! You have received a personal award!
Click on the badge to view your Board of Honor.
Do not miss the last post from @steemitboard!
Participate in the SteemitBoard World Cup Contest!
Collect World Cup badges and win free SBD
Support the Gold Sponsors of the contest: @good-karma and @lukestokes
Congratulations @foobarme! You received a personal award!
You can view your badges on your Steem Board and compare to others on the Steem Ranking
Vote for @Steemitboard as a witness to get one more award and increased upvotes!