Tone Vays, Blog Prezesa and Alessio Rastani present their current view on the Bitcoin market in a nutshell for those who have no time to watch their excellent video analysis.
Tone Vays
youtu.be/8b6Lp9hwOBo
Bullish Scenario
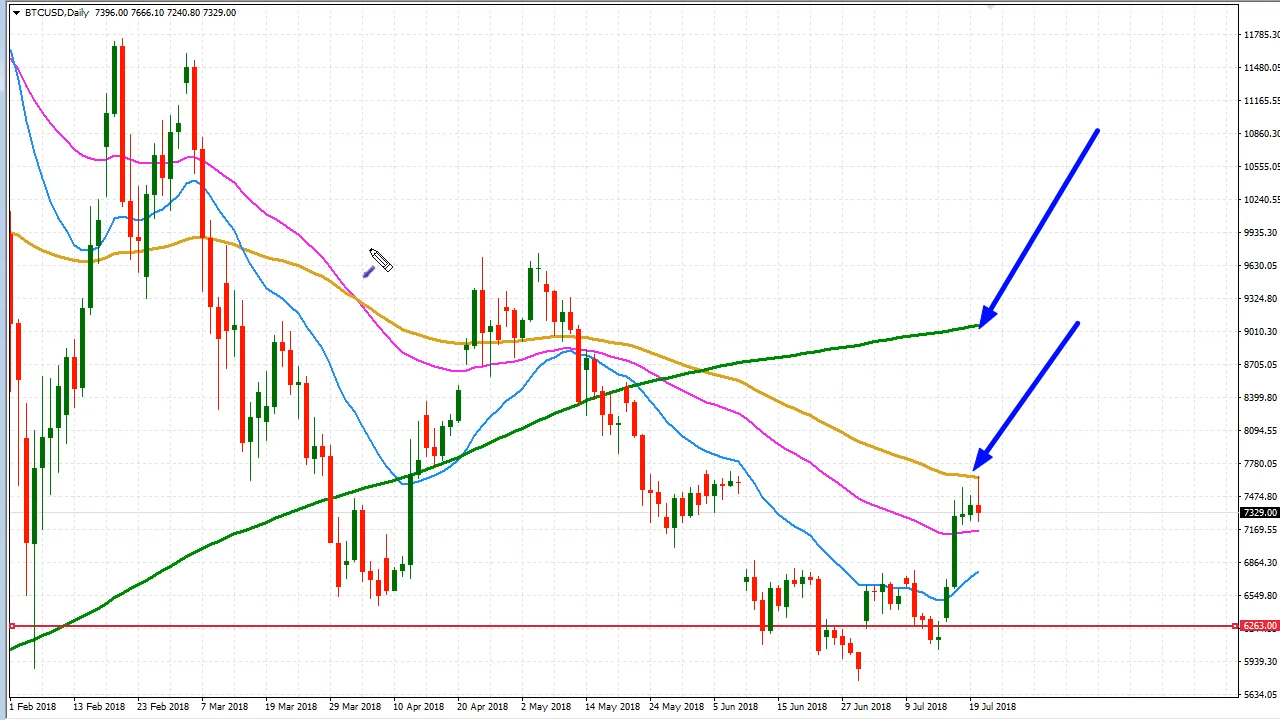
After yesterday's big bounce to the upside Bitcoin is now on the daily chart very close to the Death Cross. With every $300 to $400 hundred upswing it's gonna run into a significant resistance and he doesn't know if this resistance isn't going to crush the price of Bitcoin back to the downside.
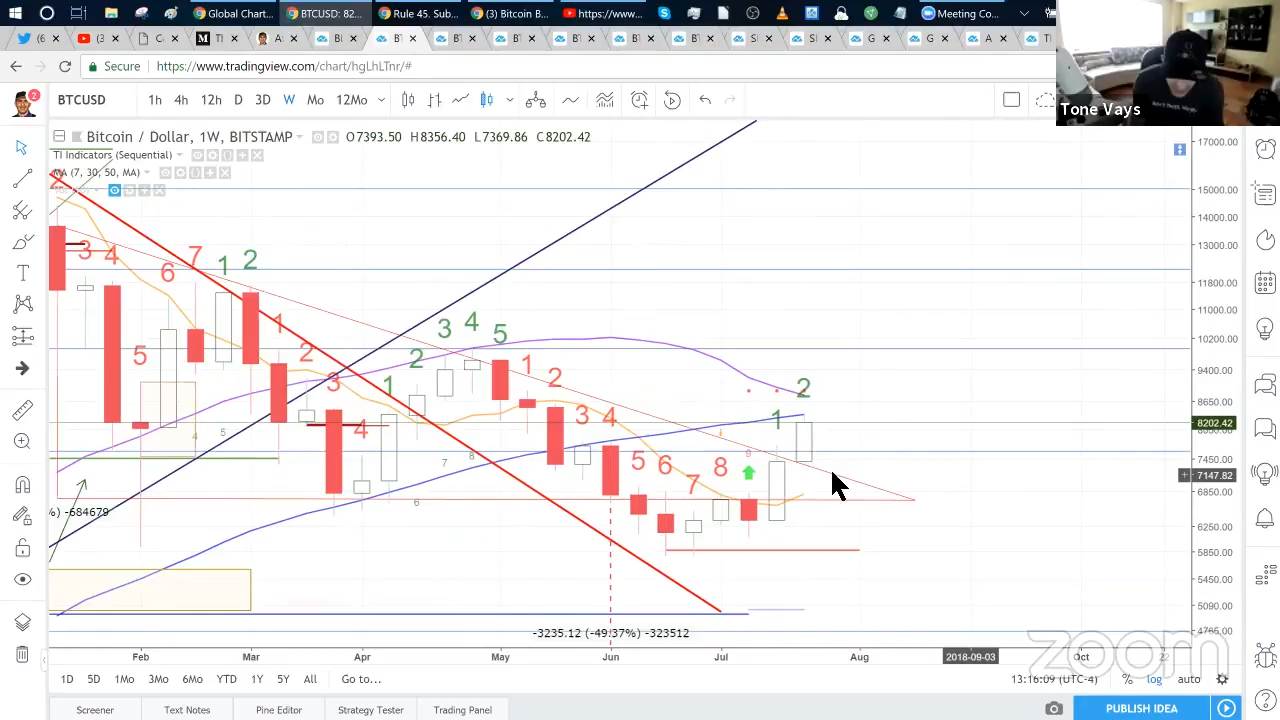
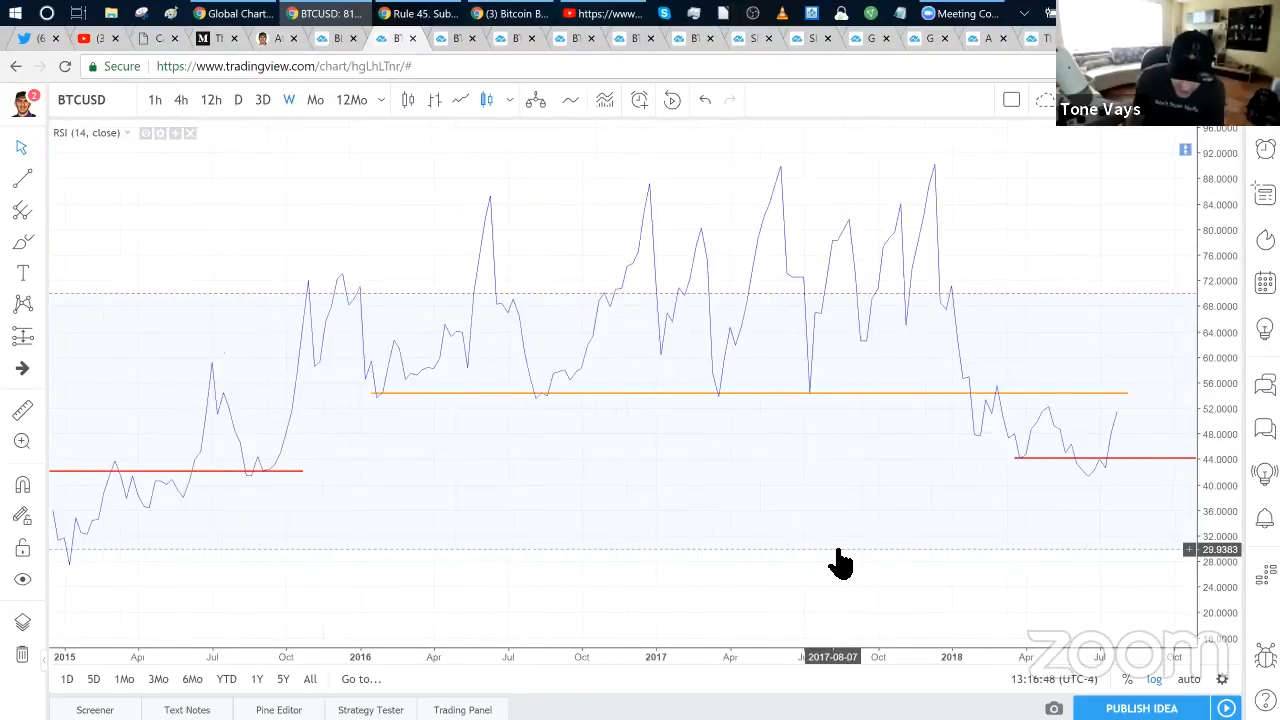
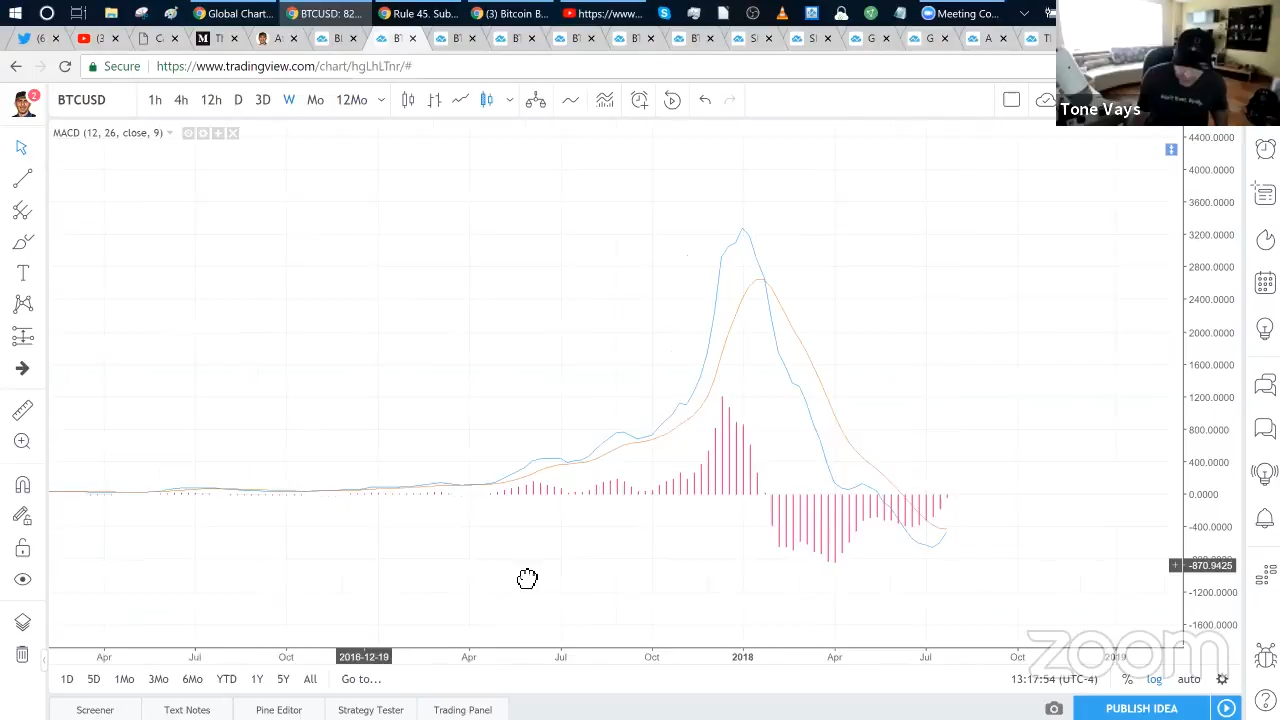
The only reason he can see right now to be Bullish on the price of Bitcoin. TD Sequential system on the weekly chart gave him first the red 9 candle and then a price flip and green 2 above green 1, which for the sequential traders is as bullish as it gets. Additionally but less importantly the RSI on the weekly is now approaching it's previous heights and MACD is also very close to the crossover, but this is only like a quarter of another reason to be bullish, because when it comes to the oscillators, intraweek doesn't matter, we need to wait for the close of the week.
Bearish Scenario
We are below the sequential setup trend (red dotted line). We're coming up on the Death Cross. We're still below the prior high and we have not established yet a new higher low. We also have a medium term (30) moving average trending down. So from the technical perspective there is still a lot more negative than positive.
Tone is still skeptical because the sequential system alone is not enough for him to have conviction that we're ready to go to all time highs.
Blog Prezesa
youtu.be/3HAnhoSbRQI
Overview
He thinks that this bounce we are in since the 16th of July is probably only a correction bounce, although quite strong but in his view it will probably be a short lived and we'll soon continue moving downwards again.
The rest of the Altcoins in comparison to Bitcoin are looking quite weak at this moment. It seems that most of the traders have moved to trading Bitcoin. It's worth mentioning that in 2015 when this last bubble started forming, only Bitcoin was gaining in the beginning and nothing else, and then Dash joined in, then again nothing for a while and in the end the rest of the Alts also joined in. So now that only Bitcoin is gaining and the rest are more or less stuck in their price levels, seems like a normal behaviour for this market. First Bitcoin is gaining and then when there is a lot of cash already pumped into it, it's spilling over the rest of the Alts. So this could a possibility in the trend direction change.
Bullish Scenario
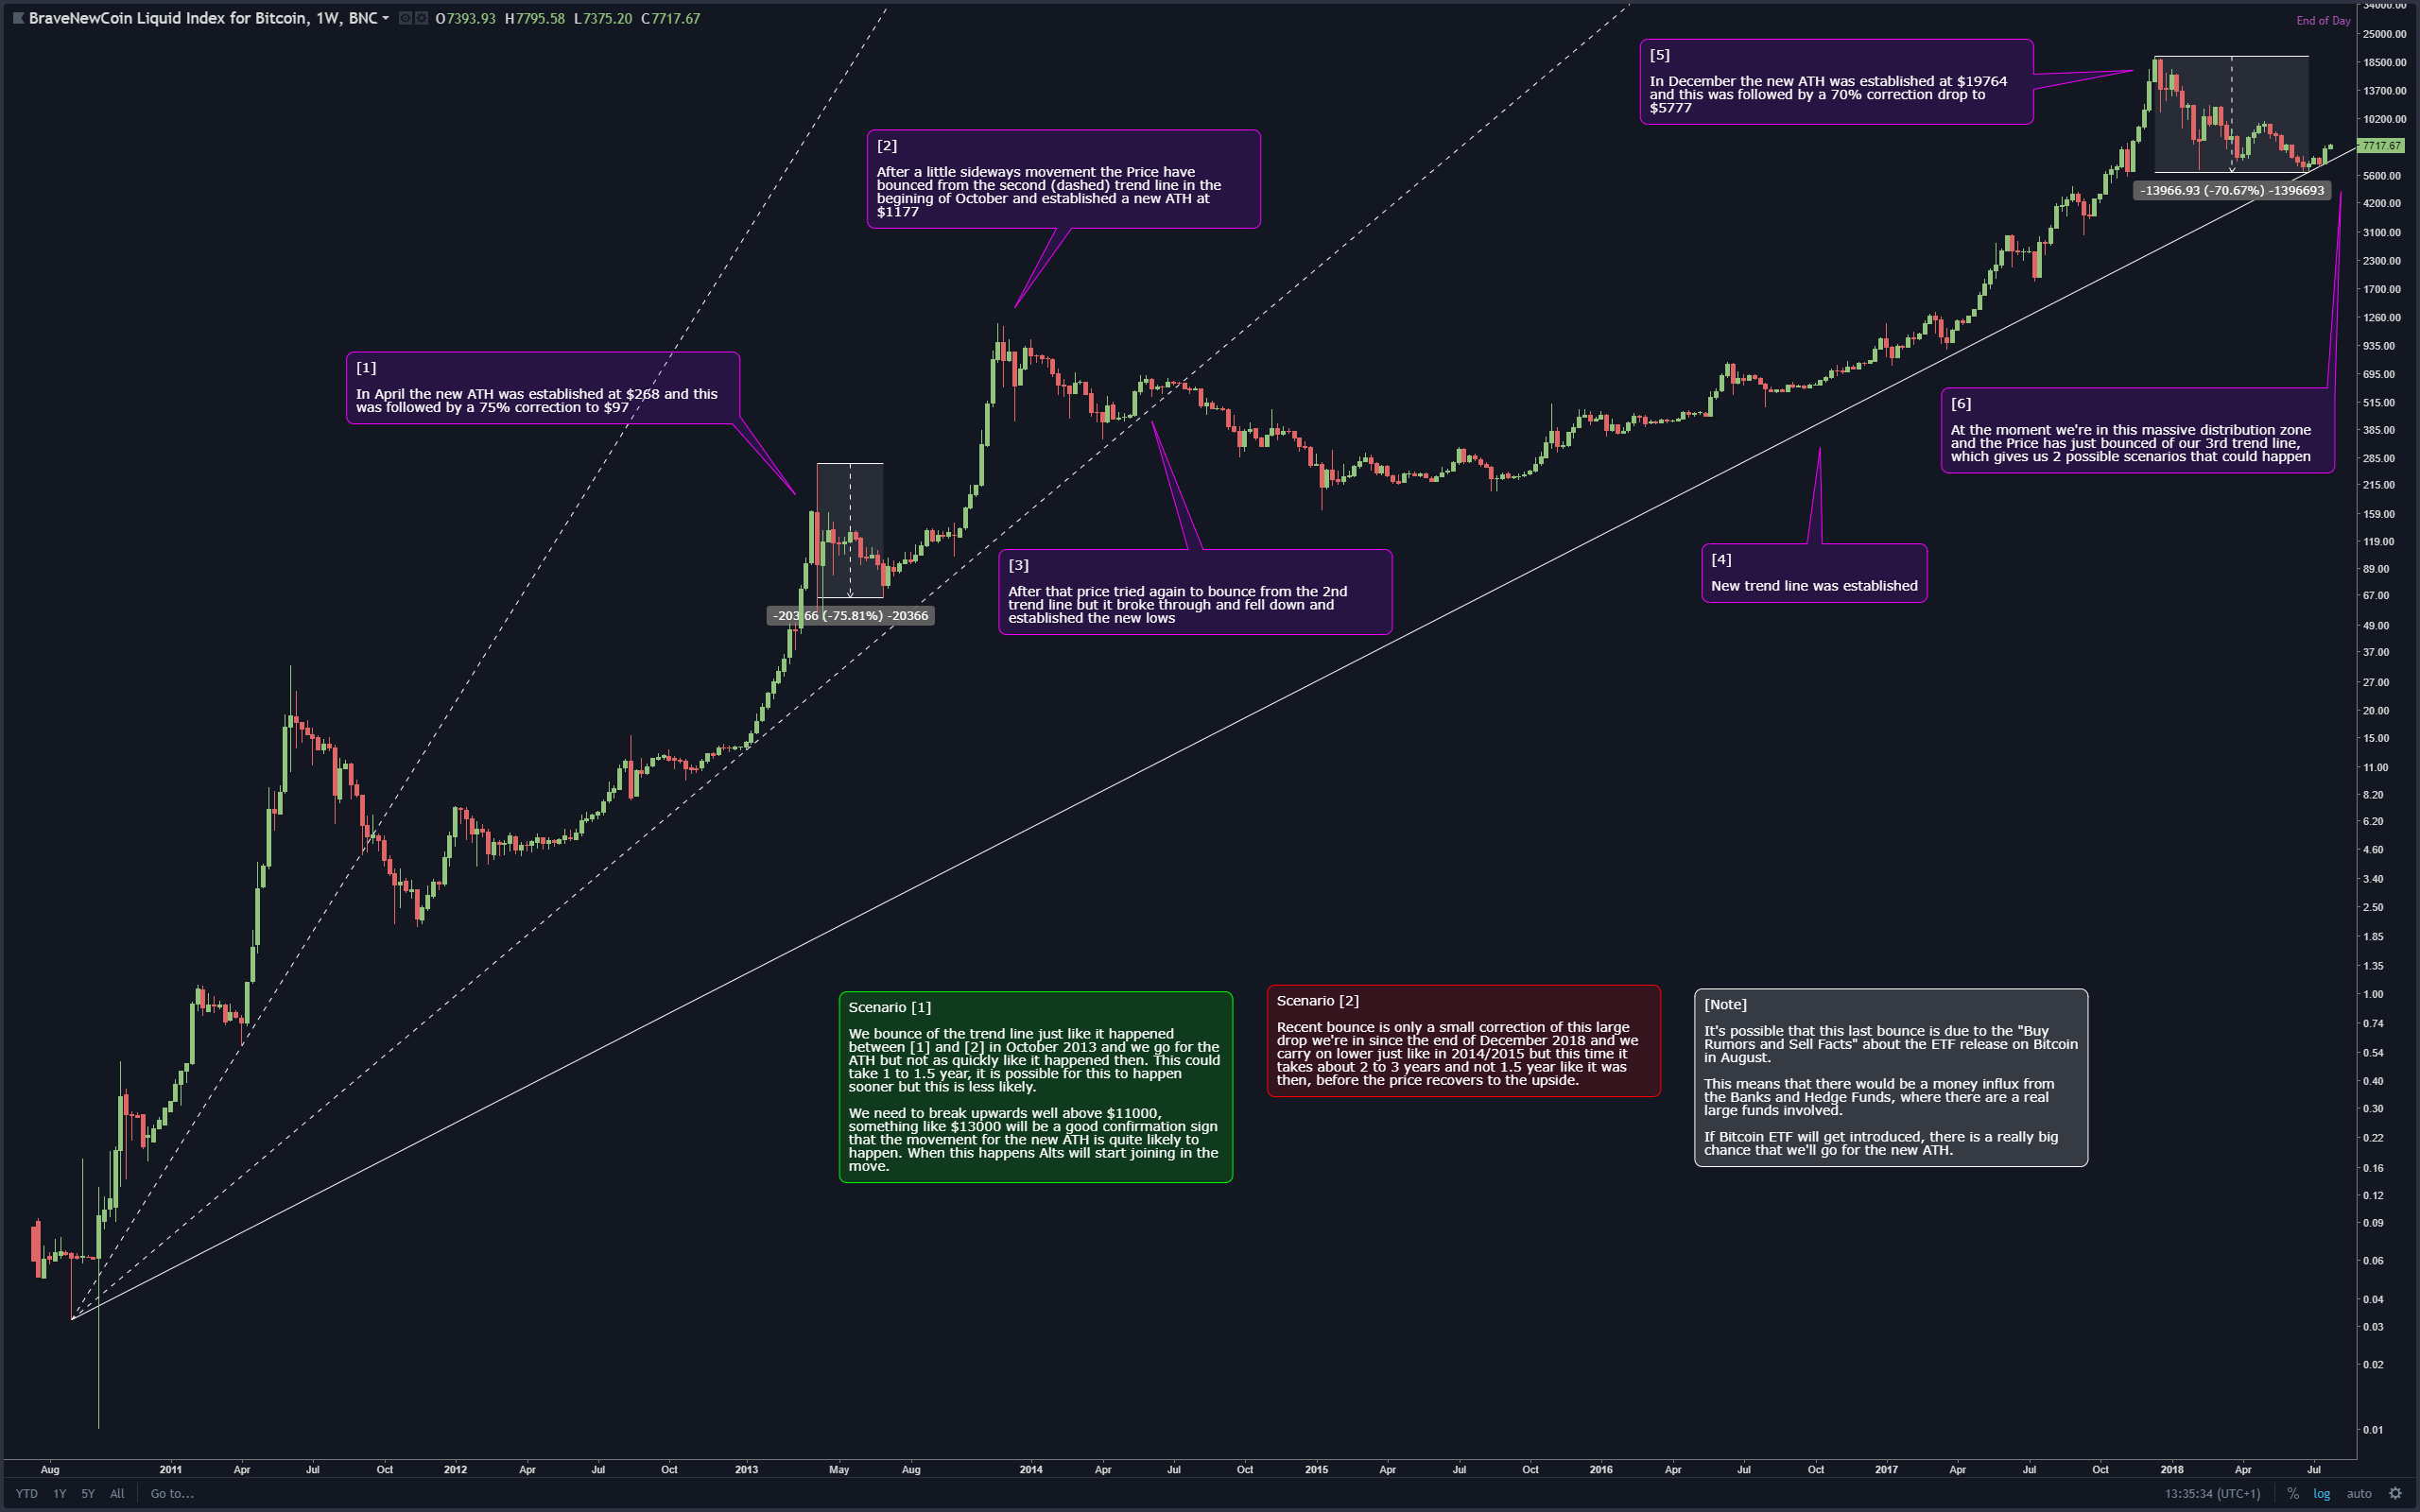
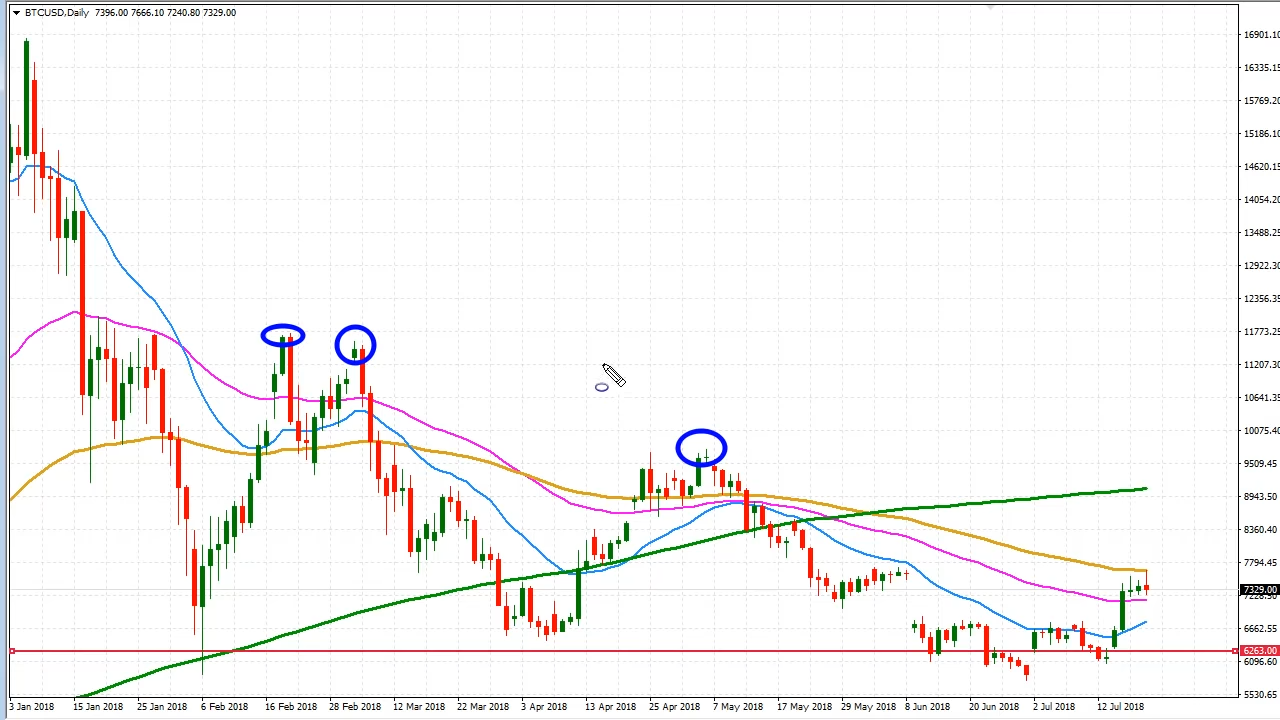
We bounce of the trend line just like it happened between [1] and [2] in October 2013 and we go for the ATH but not as quickly like it happened then. This could take 1 to 1.5 year, it is possible for this to happen sooner but this is less likely.
We need to break upwards well above $11000, something like $13000 will be a good confirmation sign that the movement for the new ATH is quite likely to happen. When this happens Alts will start joining in the move.
Bearish Scenario
Recent bounce is only a small correction of this large drop we're in since the end of December 2018 and we carry on lower just like in 2014/2015 but this time it takes about 2 to 3 years and not 1.5 year like it was then, before the price recovers to the upside.
Note
It's possible that this last bounce is due to the "Buy Rumors and Sell Facts" about the ETF release on Bitcoin in August. This means that there would be a money influx from the Banks and Hedge Funds, where there are a real large funds involved. If Bitcoin ETF's get introduced, there is a really big chance that we'll go for the new ATH.
Alessio Rastani
youtu.be/JMV90LG7jx4
Bullish Scenario
Reason 1
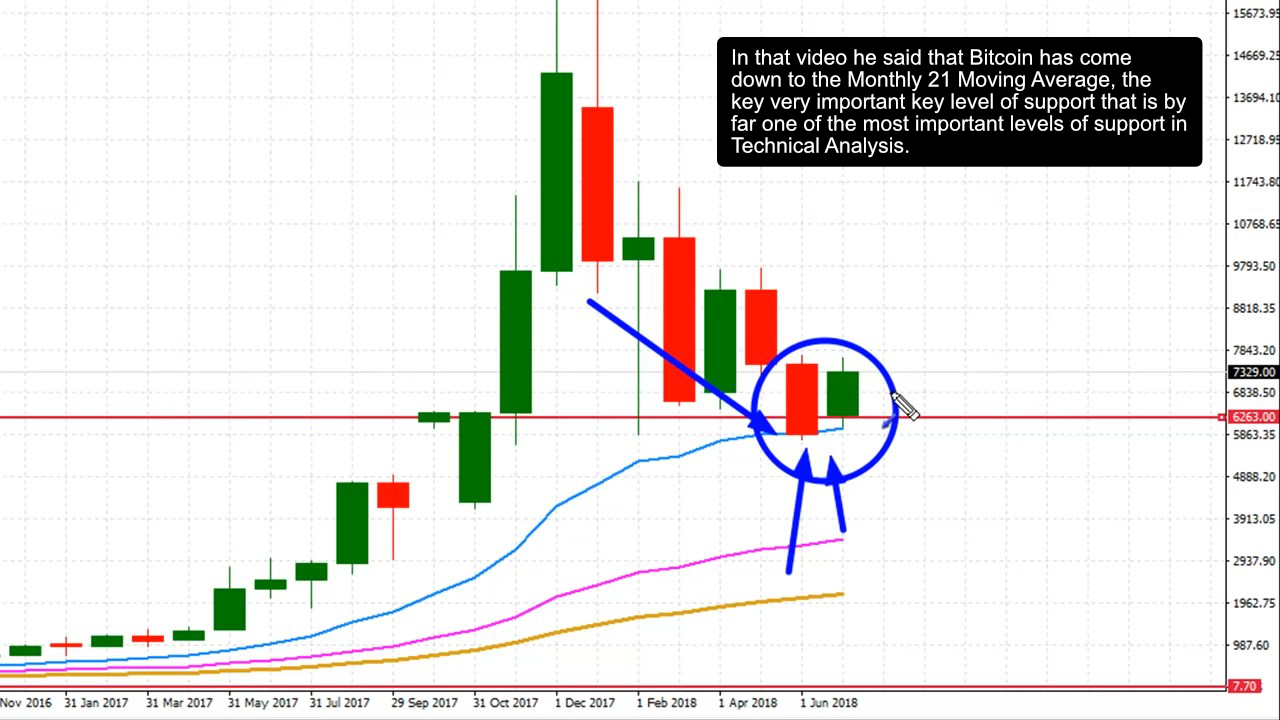
In the video from July 8th he said that he believes that Bitcoin has finally bottomed out and as long as Bitcoin remains above 6000 level it will remain bullish. He disagrees with that this is just another small correction on the way to the lower levels below below the 6000.
In that video he said that Bitcoin has come down to the Monthly 21 Moving Average, the key very important key level of support that is by far one of the most important levels of support in Technical Analysis. So far Bitcoin managed to bounce from this level.
Reason 2
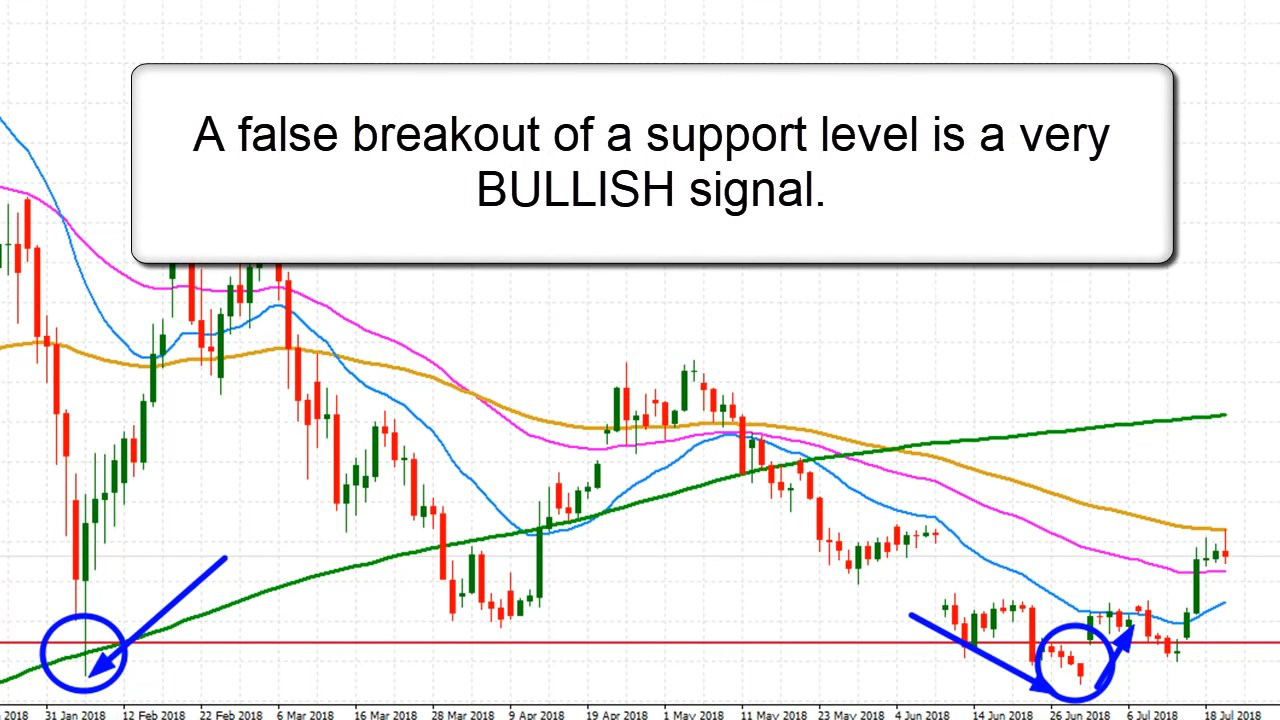
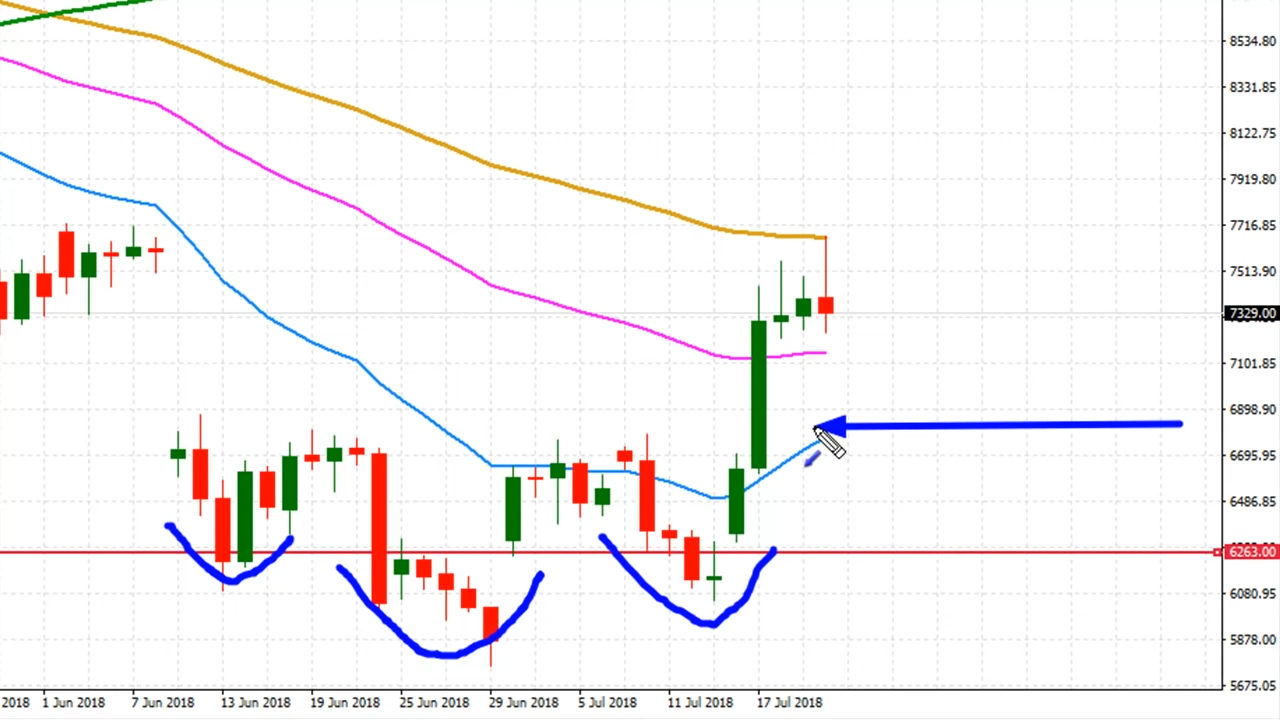
What we experienced then was a False Breakout, meaning that Bitcoin came back to this previous level of support from the 2nd of February and it took that level out and immediately went back above it. A false breakout of a support level is a very BULLISH signal. s
Reason 3
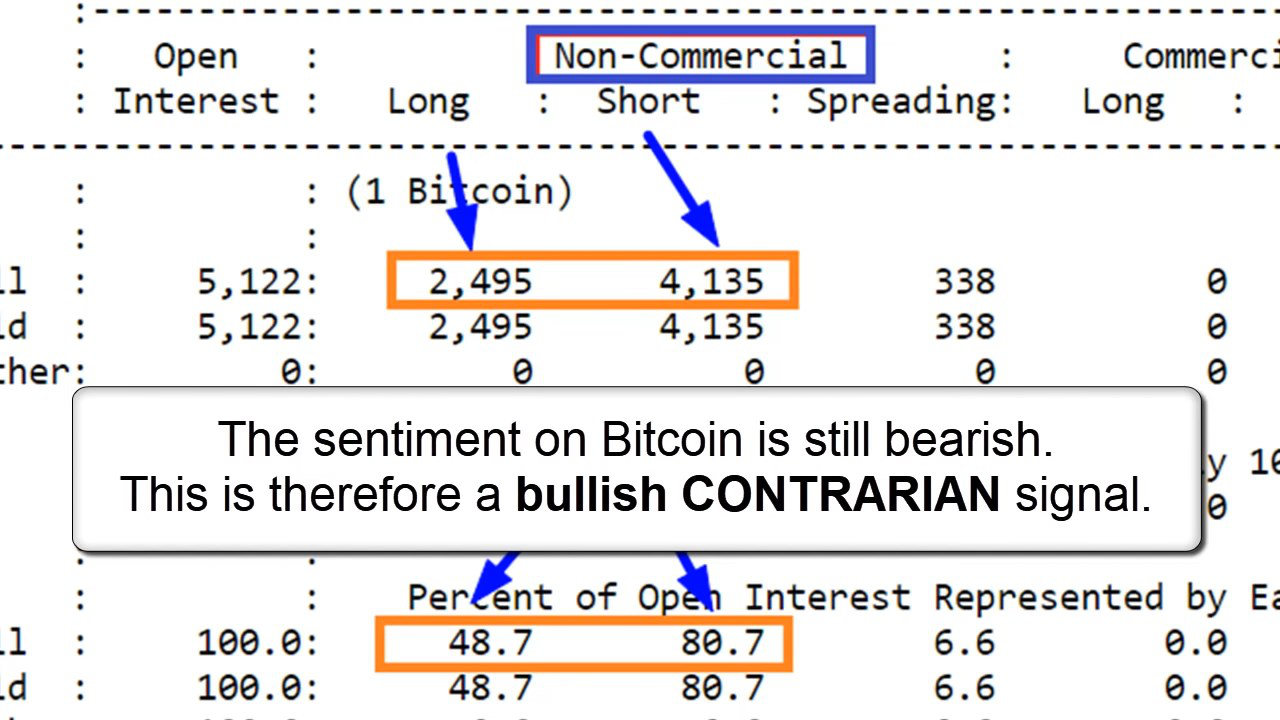
According to the last Commitment of Traders report from the 17th of July 2018 there were 4135 Shorts in contrast to 2495 Long positions held by the "Dumb Money". That means that the majority of the Bitcoin traders out there have still been bearish, that means that the sentiment on Bitcoin is still bearish. This is therefore a bullish contrarian signal.
Reason 4
This would include many patterns that show up on the charts, like for example the Head and Shoulders reversal pattern.
Bearish Scenario
Evidence against the bullish scenario include the Daily 100 EMA and 200 SMA resistance levels. Previous heights in Bitcoin at 10,000 and near the 11,000 to 12,000 levels.
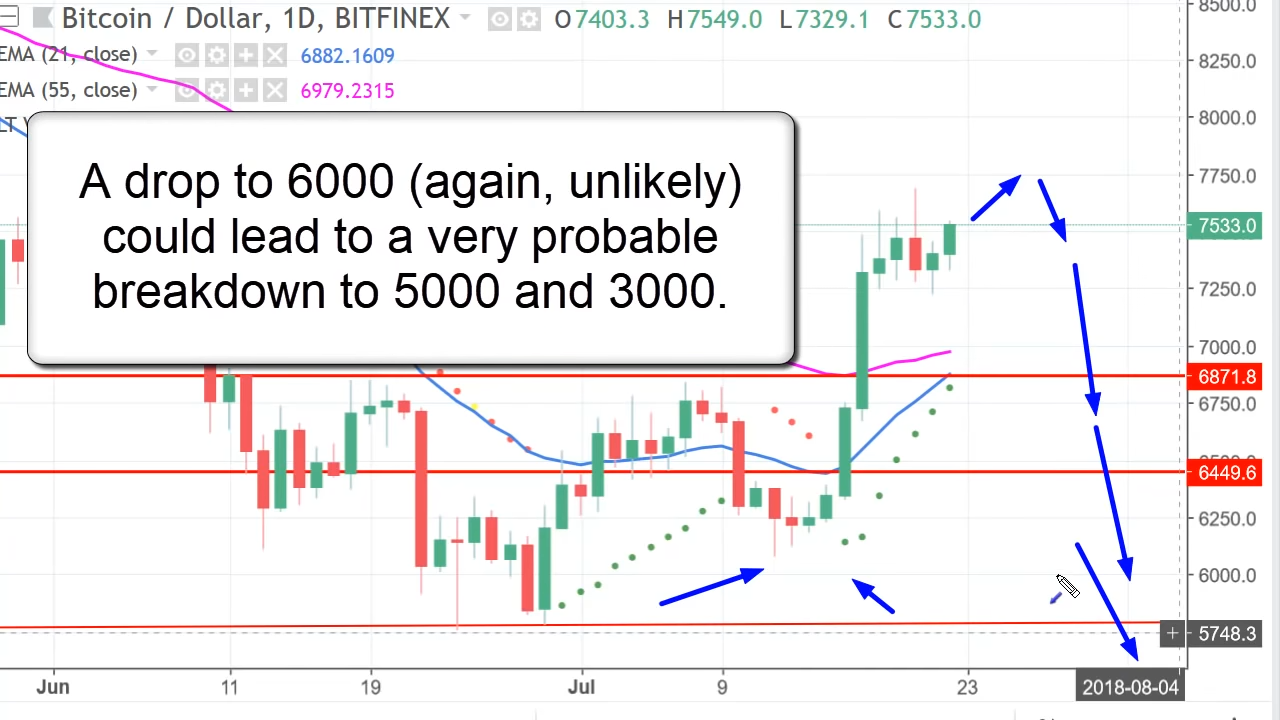
Huge warning sign that something is wrong would be if a Bitcoin falls below 6800 levels.
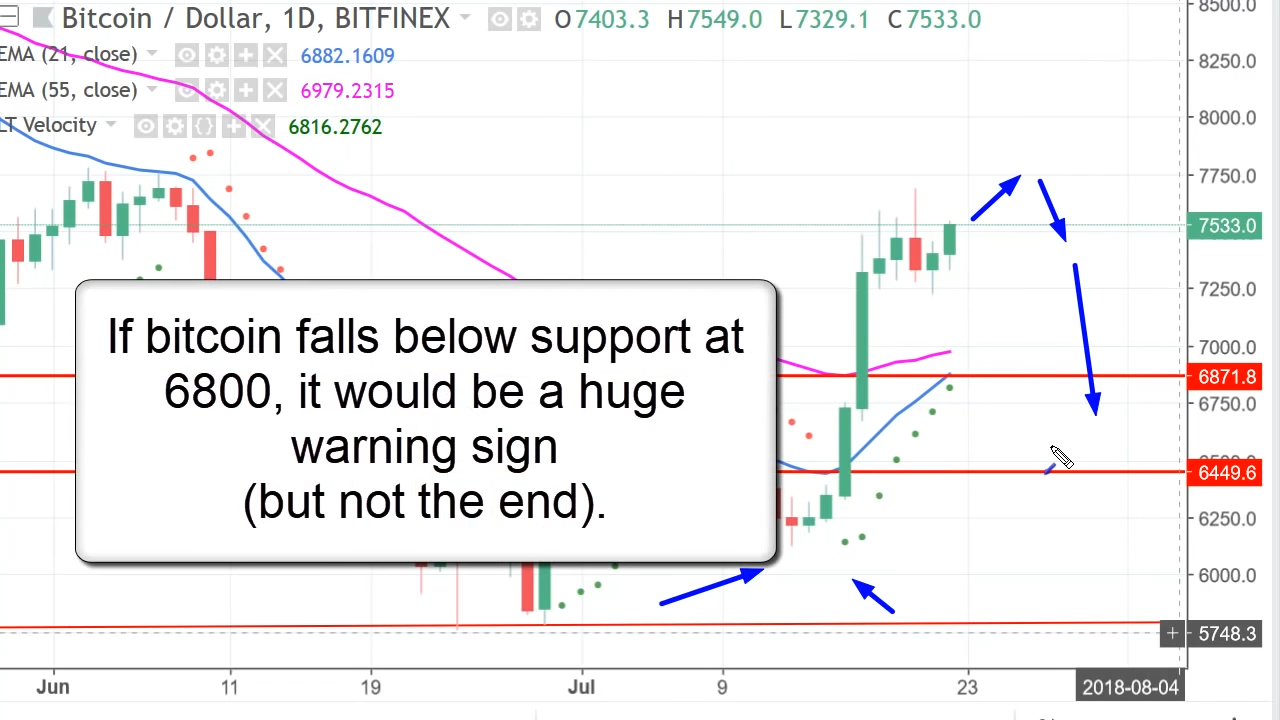
If Bitcoin falls down to 6000 levels, this would be a red flag, a warning that would mean that Bitcoin has 75% to 80% probability of dropping much lower to 5000 or even 3000 levels.