Regular daily update on BTC ta analysts opinions.

My summary - short-term (next 24h) sentiment: bullish (last: bullish)

We pumped to 7'500 and smashed the strong resistance at 6'800 making a new higher high.
RSI on daily is getting close to overbought.
RSI on 4hr is strongly overbought.
It seems bulls are back. Only the volume is not that great.
Next major resistances are 7'664 (MA128 daily) and 8'280 (MA50 weekly).
I expect a pull back but than a continuation of the bull move.
Still I think it is to early to call the bear market to be over - all those of you getting excited should be cautious for now.
Bull scenario*:
- We made a new higher high.
- We smashed through strong resistance zone at 6'800
- Next will be to make another higher low.
- Get through 7'800 resistance.
- Volume needs to increase.
- We go towards the 30/50 week MA and break above it.
Bearish scenario*:
- We move up for one or two weeks into the death cross (30 and 50 MA weekly) at around 8'500 and than drop significantly.
- Alternate - bears are turning after the RSI gets oversold an make a lower low
- After breaking 5'800 a significant drop towards new lows in the range of 4'975 and 4'300.
*scenarios based on daily-candles - so around 4-14 days timeframe. See also definition section
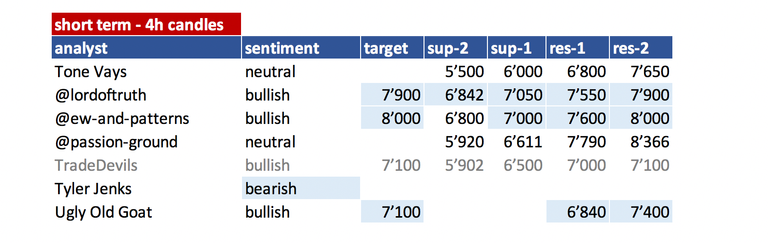
Summary of targets/support/resistance of TAs
Short-term overview
mid- and long-term overview
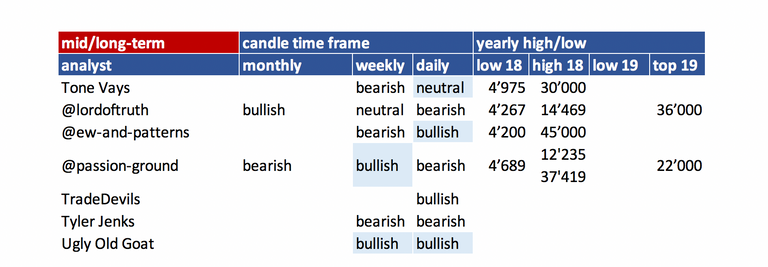
- please refer to definition section for time-horizon.
- be aware that mid- and long-term is mostly my interpretation of what analysts sentiment is as they not always clearly differentiate those time-frames. To interpret that consistently is very hard so please be kind with my interpretation.
- you can easily spot which analyst did an update
(block writing - grey ones don't have an update today).
Their changes are in light blue.
Helpful statistics:
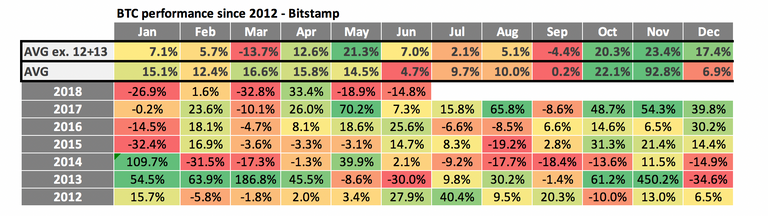
monthly performances
- Added 2012 + 2013 on request.
- As 2012 and 2013 the % move are gigantic I added two averages. One without 2012 + 2013.
- June performance was very weak. With -14.8% clearly below the average of the last years. With 2013 this is the only negative month at all.
- July is a mixed bag - 2 year positive performance and 2 year of negative performance. 2012 and 2013 were positive though.
- The average is positive with 2.1% but that is mainly due to the bull rund 2017. The average incl. 2012and 2013 is even more positive. That is mainly due to the 40%+ spike in 2012 so I wouldn't rely on that.
So just looking at this table we probably facing another negative month.
News about the blog
- None
Analysts key statements:
Tone (neutral):
Quarterly chart: We are almost done with 1-4 correction. October / November could be the bottom.
Monthly: We are on 5 of 9 - looking for 4 month of downside. Which would bring us also to November as a bottom.
Also we never had a big reversal on this scale.
Short-term outlook:
- Weekly: We were at the bottom of the triangle and broke out. We had big re-bounces before (e.g. in 2014). It is possible that we turned into bull market but he still believes that this is unlikely (10%).
- Daily: iSHS pattern has been completed. Neckline at 6'800 - the target is 1'000 -> 7'800.
No he is waiting if we consolidate at the top - he would love BTC to go up to the death cross of 30/50 MA which would be a high likely short play.
@lordoftruth (bullish):
Conform 4H, Bitcoin price continues bullish rally after breaking 6'842 and the confirmation of IH&S pattern, so we expected the continuation of the rally towards 7'900 as long as the price above 6'842.
The Expected Upmove remain valid conditioned by price stability above 6'842.
Todays trend is bullish. Trading between 7'050 and 7'900.
@ew-and-patterns (bullish):
It is too early to call it a bottom, but I want to show you the best case today. Let's say this impulse wave continues past 8'000 and finally past 10'000...
If so, this is the most probable best case.
It would form a cup pattern, possibly with a handle afterwards.
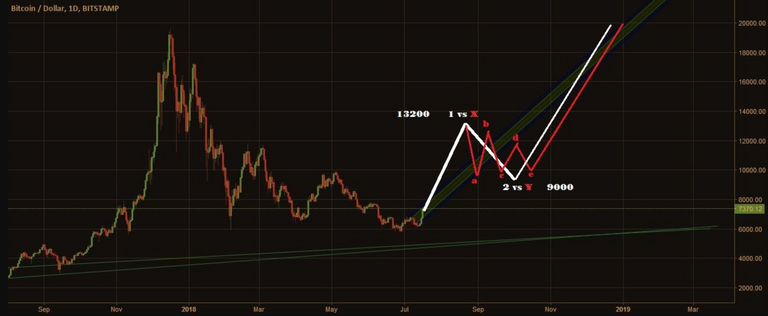
This move could bring BTC up to 13'200 for wave 1 or X. If it's wave 1, we will likely see any other correction but not a triangle. If it is wave X though, a triangle is very likely due to the rule of pattern alternation. We would have a ZigZag for W, an expanded flat for X and a triangle for wave Y (red).
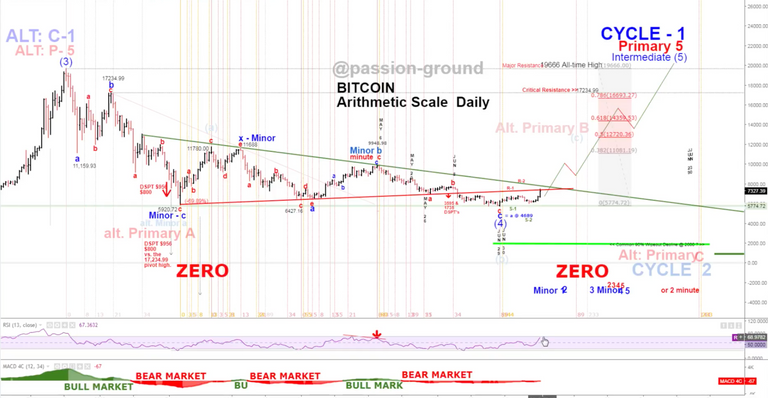
@passion-ground (neutral):
Here we are, and yet – it still ain’t over till’ it’s over… …the BEAR MARKET that is.
Bearish on the higher level. Next turn month is August.
Daily at his R1 line and gets rejected so far. We are rapidly moving towards RSI overbought.
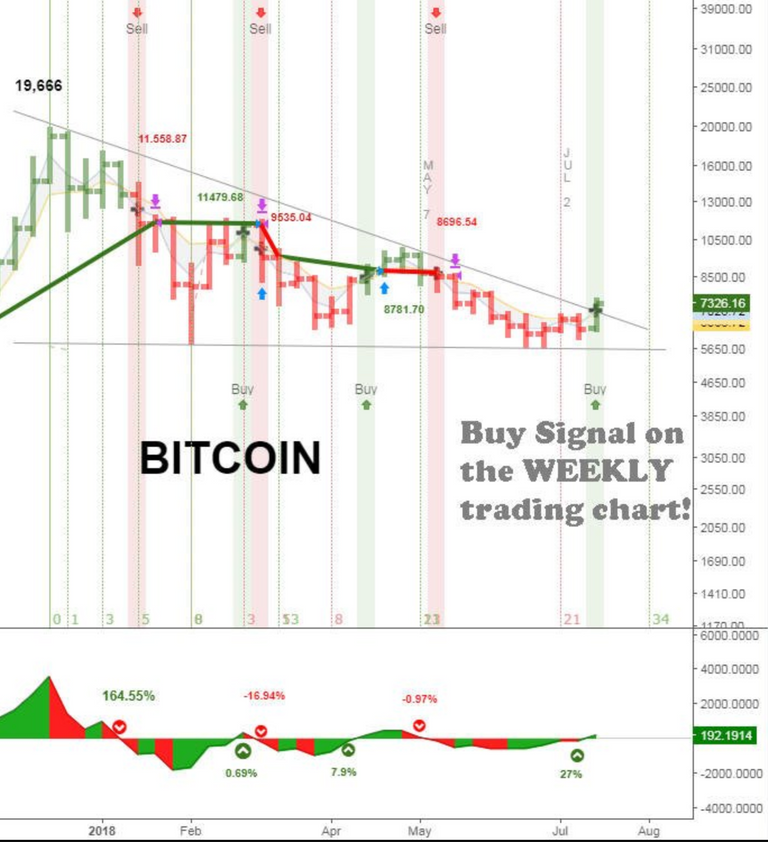
Weekly - we are moving into a buy signal - long term. We are about breaking out of the downtrend (log chart). We are in a descending triangle and breaking upwards.
TradeDevils (bullish):

- bullish view - primary
We have a higher low - next step is to get a higher high.
He is expecting us to go up into stiff resistance at 7'000 - 7'100. From there a 0.5 correction to 6'500. If we go there in 3 waves that looks like a "must buy" as he sees us going up in wave 3 towards 7'800 after that.
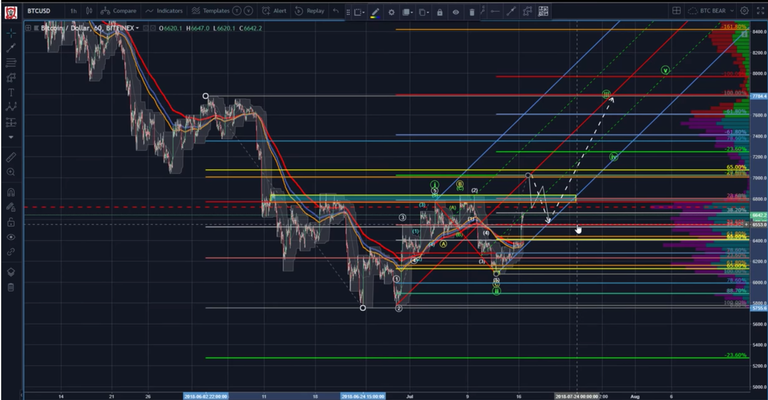
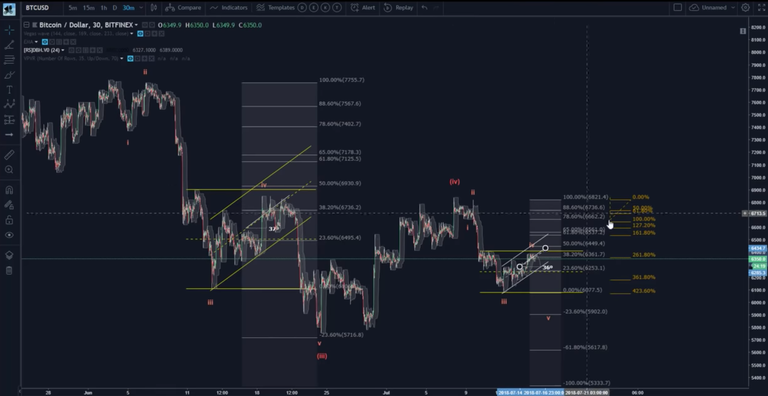
The bearish view - Alternate - we go down from here to 5'900. This is based on the ew count as this being a wave 4 and now expecting wave 5 down. Also we have a fractal which almost looks identical (see picture).
Tyler Jenks (bearish):
He missed the move up but he is expecting short term a 5% move down of bitcoin. He is not changing his intermediate and long term projection (bearish).
He has positioned itself still in cash and is convinced that he can buy BTC below 5'000 at some time in the future.
UglyOldGoat (bullish):
He sees that swing traders are caught - they sold the upmove and went short.
The question now is just how badly are the swing traders caught. . . . their dilemma is they can either hold the short and hope for a reversal . . . take the loss and wait and see . . . or double down. . .
I guarantee you one or more of the big boys doubled down.
So now what? The two week high is now 6820-6840 across all markets. There should be lots of stops above this area. Since we have been in a swing market this could be the extent of the rally. . . and sufficient to resume the bear. . . but more likely we will blow through the 6820 area . . . a move to the 7100–7400 area. . . and then the squeeze is on big time. The train has left the station. You must chase it down to get on board.
Normally a position trader would add to a position on the breakout above 6820 . . . but in this case it is probably best to trim your long position if we get some large rekts above 6820. . . 6000 held again . . . the basis indicated bitcoin would not breakdown. . . again . . . the relative strength of bitcoin to alts continues. . . LTE, ETH, XMR, and XRP all had secondary rallies after bitcoins peak. . . bitcoin may now have its turn . . . feel the love.
A move up is required if we are to eventually break the 6000 and a move up is required if we are headed for a double top.
IT's time to pull the trigger
The basis, relative strength, the timing indicators all say it is time to pull the trigger and risk 1st and 2nd quarter lows. Yes, if we break it will be hard but that is fear. . . everything else says this is a low risk time and place to be a buyer.
Reference table
| analyst | latest content date | link to content for details |
|---|---|---|
| Tone Vays | 17. July | here |
| @lordoftruth | 18. July | here |
| @ew-and-patterns | 18. July | here |
| @passion-ground | 18. July | here |
| @tradedevil | 17. July | here |
| Tyler Jenks | 17. July | here |
| UglyOldGoat | 17. July | here |
Definition
- light blue highlighted = all content that changed since last update.
- sentiment = how in general the analysts see the current situation (bearish = lower prices more likely / bullish = higher prices more likely). The sentiment is based on 4hr, daily, weekly, monthly candle charts.
- The forecast time horizon of candles can be compared with approx. 4hr = 1-2 days; daily = 4-14 days; weekly = 4 - 14 weeks; monthly = 4 - 14 month.
- target = the next (short term) price target an analysts mentions. This might be next day or in a few days. It might be that an analyst is bullish but sees a short term pull-back so giving nevertheless a lower (short term) target.
- support/res(istance) = Most significant support or resistances mentioned by the analysts. If those are breached a significant move to the upside or downside is expected.
Educational links:
- From @ToneVays: Learning trading
- From @lordoftruth: Fibonacci Retracement
- From UglyOldGoat: How to achieve the same results of a professional trader without taking the inherent risks
- From @philakonecrypto: Like in every post you find links to his amazing educational videos. For example here. In addition he has an online course which you can find here
- From @haejin: Elliott Wave Counting Tutorial
*If you like me to add other analysts or add information please let me know in the comments.
Comprehensive research.. I really appreciate your work. Lots of positive news are coming. I am sure everyone will witness the bull run soon.
@famunger I appreciate your research and the fact that you have showcased all the information at just one place. As for the fact.... The market might go bearish so one should be careful.... Use top-loss and HODL.
Bitcoin has gone through many phases in these times.
Eheh everyone bullish after such a huge up-movement ;)
Yeah - Only UglyOldGoat was spot on at the low.
Bitstmap chart since 2012 is awesome :o
There are reason bitcoin go to up again. Good new!!
@famunger you were flagged by a worthless gang of trolls, so, I gave you an upvote to counteract it! Enjoy!!
Which is perfect time to enter in crypto..
Someone say it's right time..
What you think about ETF ?
Tell me Which is best coin for invest now..
If you are crypto adviser than say me to follow you..
Congratulations @famunger! You have received a personal award!
Click on the badge to view your Board of Honor.
Do not miss the last post from @steemitboard:
SteemitBoard World Cup Contest - The results, the winners and the prizes
your summary in the beginning says "4 hr rsi strongly oversold" i believe you meant to say overbought..
Oh yeah - sorry. Correct!