Update - I missed a post of passion-ground (unfortunately 2 days ago). Just updated it.
Regular daily update on BTC ta analysts opinions.

**My summary - short-term (next 24h) sentiment: bearish ** (last: bullish)

We dropped to 7'400 ish and found hold for now at 7'400 - 7'700 range.
Bear/Bull case updated.
Very intense time ...
It seems in the war of the bears and bulls we are entering another battle: Can the bulls create enough FOMO to create distance to the lows and overcome major resistance levels? If so we are not going to see the current levels for a long time.
Or do the bears lead the bulls into a trap and than smashing hard to the downside. That would create a lot of frustration and might lead to the capitulation which you would expect to be necessary to call the bear market over.
Bull scenario*:
- This down move is "only" wave 4 turning back up above 6'800.
- That confirms a higher low.
- In the following wave 5 we go higher than last swing high to around 9'100 area overcoming the death cross.
- Volume needs to increase.
Bearish scenario*:
- We dropped from the death cross making a lower high.
- We are going down further and stay clearly below the swing high 8'500.
- After breaking 5'800 a significant drop towards new lows in the range of 4'975 and 4'300.
*scenarios based on daily-candles - so around 4-14 days timeframe. See also definition section
Summary of targets/support/resistance of TAs
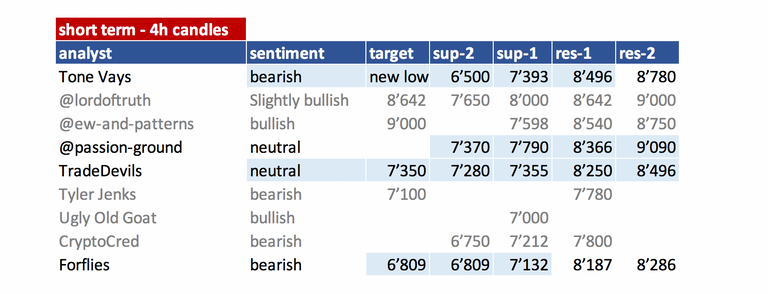
Short-term overview
mid- and long-term overview
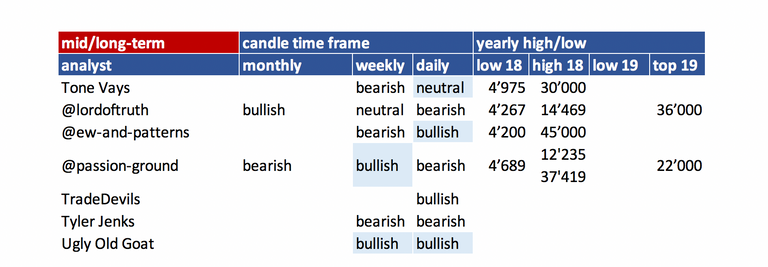
- please refer to definition section for time-horizon.
- be aware that mid- and long-term is mostly my interpretation of what analysts sentiment is as they not always clearly differentiate those time-frames. To interpret that consistently is very hard so please be kind with my interpretation.
- you can easily spot which analyst did an update
(block writing - grey ones don't have an update today).
Their changes are in light blue.
Helpful statistics:
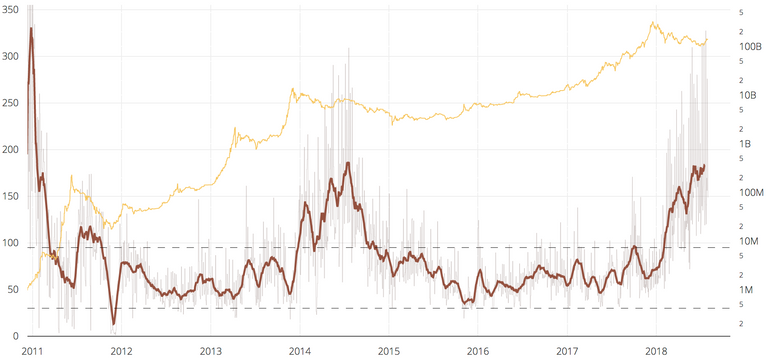
NVT ratio
Last high: July 2014 at 185.7
December 2017: 91.8
July 2018: 177.9
So the NVT is moving up to extreme levels. For those believing in this ratio this is seen as an sign of bitcoin being strongly overvalued.
monthly performances
July was a rather decent month with +20% up - not correlating with July of other years.
August seems to be another mixed bag - lets see how it turns out.

News about the blog
- Added NVT ratio from
- if you are not familiar with it see definition section below.
- Forflies: I added him not knowing him too well - that is why his logo is in grey box - meaning under evaluation.
Analysts key statements:
Tone (bearish):
Monthly: We got rejected by 7 month MA (about the 200 MA daily).
Weekly: Death cross reversed us. We made a lower high and he assumes that we are going to see a new lower low. He is waiting for us to trading and close below last weeks candle. That is his confirmation that the lower high is in.
Only chance we put in a higher low above 6'500.
Daily: Daily turned officially bearish with a 2 trading below a 1.
@lordoftruth (slightly bullish):
on holiday until August 5th.

TBitcoin price fluctuates above 8'000 barrier, trying to resume the
main bullish trend ( The trend is slighty bullish as long as the price above 7'650 ) supported by Stochastic Positivity.
But the price appears to be faced some bearish pressure ( As we expected in our previous post ) before the Major Resistance at 8'642 and might be forced to retreat from the climb, to test 7.650K before the moving ( In absence of another set of positive developments to sustain the climb ) towards 38.2% FIB level near 7.050K, supported by RSI Negativity.
Todays trend is Slighty Bullish. Trading between 7'650 and 8'280.
@ew-and-patterns (bullish):

BTC is showing clear evidence of blue wave 4 coming to an end soon. This means the final wave up to complete this bigger white wave 1 is about to start soon as well.
This is ultra important! We need to see at least 8500+1 to have some confidence that this is infact an impulse wave and not some ABC correction within a bigger correction.
Blue wave 4 could be done already, but a little lower does not hurt the count at all.
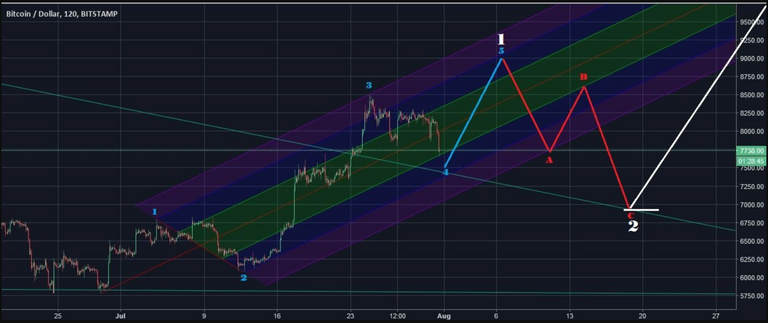
A good target for this blue wave 5 of white wave 1 would be 9000$.
White wave 2 is where I will be buying. Alts and BTC... stay tuned...
BTW: If this playes out like shown in this pic (up to 9k, then down to 7k), white wave 5 target is 13500 (if white wave 3 is 162% again) which would kill a few bearish counts (but not all of them).
@passion-ground (neutral):
Financial markets of every stripe are like “Spinning Wheels” to one degree or another. BTC and cryptos are no different. What goes up must come down. And so on, and so on, and Scooby doo-bee doo-bee! Keep your “Blood, Sweat, and Tears” in check while riding these painted ponies – and let the spinning wheel spin!
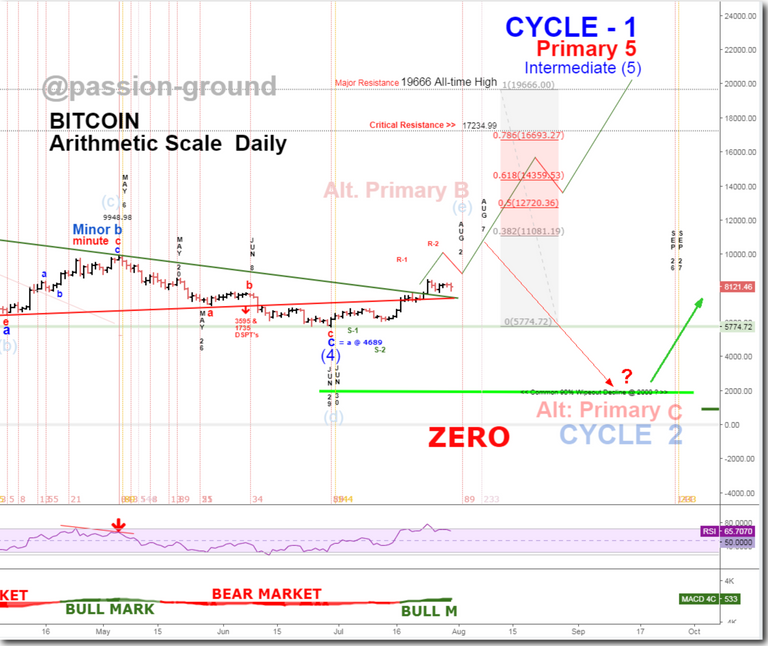
Turn month August is upcoming. That could reverse our uptrend.
Daily: Bear Markets are dominating (MACD) - currently we are still in a bull market according to this indicator on that timeframe.
If we fall below red trendline we get a sell trigger to 3'595 - 1'735.
The most bullish count we are going up to Primary 5, Intermediate 5 to complete Cycle 1 at ATH.
The most bearish count is that we are in Cycle 2 and we come down to much lower level to complete it. Cycle 3 would have than a very bullish outlook.
TradeDevils (neutral):
The battle is on.
Bear win this one rejecting us from the 0.65
Now it is decided if we hav a 5 wave impulse up - the bull case - and we are seeing wave 4. Or if the bears won and this was an ABC correction to the upside now followed by a 5 wave impulse down.
The turning point need to be in the area of 7'700 - 7'212 level. Best if we hold the 0.5 at around 7'280.
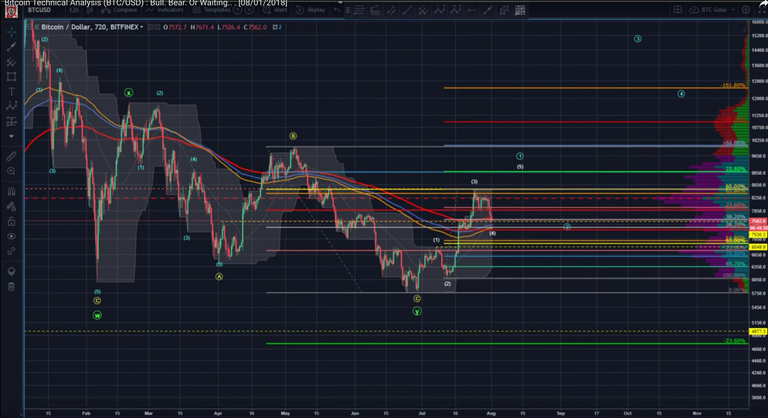
A bull play could be to buy at 7'350 - target 9'077 - stop at 7'176. ratio 9.8
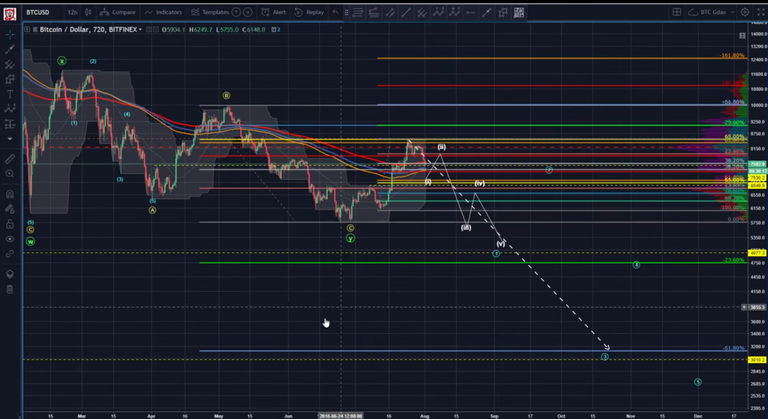
On the other hand this could be the bearish side - This being wave 1 - wave 2 is coming with not reaching up to the swing high - turning at around 8'000 and than going down for 5'800 and lower.
UglyOldGoat (bullish):

Wow! Last night I went to bed confident the uptrend was solid . . . and more bullish that ever . . . only to find we rolled over again . . . my balance dropped 15% from its peak. . . . and got stopped out . . . no matter how right you think you are . . . money management trumps all.
Time to become a small trader again.
Remember, many large traders become small traders, most small traders remain small traders, a few small traders become large traders . . . and wise large traders choose to be small traders again . . .
You do not need sharp technical skills or market analysis to be a successful trader . . . the key to success is humility and money management.
Crypto Cred (bullish):

Many intraday traders (myself included) have been roughed up recently.
Let’s take a deep breath and zoom out to the 1W.
Price is currently retesting the Weekly block it broke through last week.
Low at 7200s must hold.
If this fails, next support at 6800s.
Froflies (bearish):
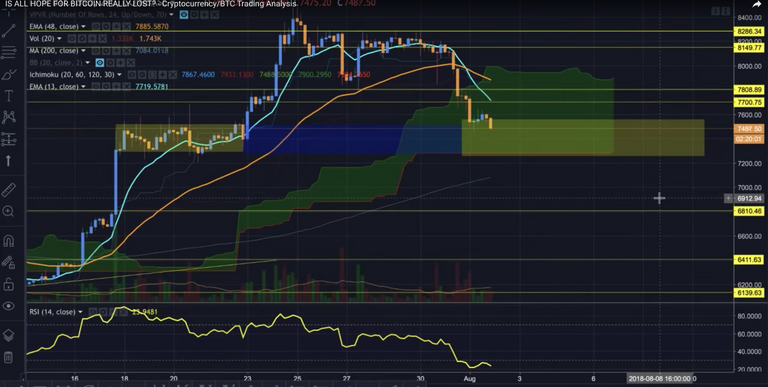
We bounced from 0.382 7'455.
He wouldn't wonder if we go to the 6'809 level 0.618.
At the moment he sees rising wedge or bear flag forming.
Current support area at 7'550 to 7'250.
 1
1
Reference table
| analyst | latest content date | link to content for details |
|---|---|---|
| Tone Vays | 02. Aug | here |
| @lordoftruth | 26. July | here |
| @ew-and-patterns | 31. July | here |
| @passion-ground | 23. July | here |
| @tradedevil | 01. Aug | here |
| Tyler Jenks | 18. July | here |
| UglyOldGoat | 31. July | here |
| CryptoCred | 31. July | here |
| Forflies | 01. Aug | here |
Definition
- light blue highlighted = all content that changed since last update.
- sentiment = how in general the analysts see the current situation (bearish = lower prices more likely / bullish = higher prices more likely). The sentiment is based on 4hr, daily, weekly, monthly candle charts.
- The forecast time horizon of candles can be compared with approx. 4hr = 1-2 days; daily = 4-14 days; weekly = 4 - 14 weeks; monthly = 4 - 14 month.
- target = the next (short term) price target an analysts mentions. This might be next day or in a few days. It might be that an analyst is bullish but sees a short term pull-back so giving nevertheless a lower (short term) target.
- support/res(istance) = Most significant support or resistances mentioned by the analysts. If those are breached a significant move to the upside or downside is expected.
- NVT Ratio = (Network Value to Transactions Ratio) is similar to the PE Ratio used in equity markets.
Educational links:
- From @ToneVays: Learning trading
- From @lordoftruth: Fibonacci Retracement
- From UglyOldGoat: How to achieve the same results of a professional trader without taking the inherent risks
- From CrytptoCred: Several great educational videos - very structured and helpful
- From @haejin: Elliott Wave Counting Tutorial
*If you like me to add other analysts or add information please let me know in the comments.
This post has been revived by steem-forever and will get extra rewards. This happens when a post is upvoted on steem-bounty.com after the 7 day post life.
Users can simple upvote via steem-bounty.com continously, so posts can live and earn rewards forever.
Authors can share their steem-bounty.com links and get upvoted forever.
We hope this will allow everyone to earn more meaningful rewards over longer timeframes than before.
Vielen Dank für deinen täglichen Report! Du steckst immer sehr viel Arbeit hinein und diese Tatsache verdient große Anerkennung! In der derzeitigen unsicheren Marktphase macht dies nicht ungetrübten Spaß, aber es kommen bestimmt wieder bessere Zeiten. Der Kryptomarkt ist noch nicht reif für einen nachhaltigen Anstieg. Es wäre schon sehr positiv, wenn das signifikante, finale Low hinter uns läge. Mein Bauchgefühl sagt mir, dass wir keine neuen Tiefstände mehr sehen.
Auch der steem-Kurs stellt uns nun auf eine Geduldsprobe, aber ich werde weiter alle SP-Rewards akkumulieren und keine Deals mit irgendwelchen Upvote-Bots machen. 100% meiner Steem-Power steht für das Voten zur verfügung.
Vielen Dank für deine anerkennenden Worte. Du triffst es genau - es nimmt doch einige Zeit in Anspruch und das täglich ist nicht immer einfach und macht aktuell tatsächlich wenig Spass. Ich bin sehr zuversichtlich das es sich auf die Dauer auszahlen wird! Durchhalten ... ich befürchte unsere Ausdauer wird nochmals einer Prüfung unterzogen ...
For many investors this mornings drop in value would have sent warning signals after the amount of times the market has pumped and then had a major sell off. The first half of the morning saw price close below the $7,800 support level and rally to as low as $7,442 before seeing price find its feet at the minor support level of $7,500 and creeping back up too $7,670 where its currently trading.
The 4hr chart highlights the clear rejection of the $7,500 level before forming a strong bullish engulfing candle to send price back up to $7,670. The most likely short term scenario for me is a retest of the $7,800 and a possible continuation of this bearish movement down to the support of $7,500 and potentially $7,250. It will depend on how price reacts to the $7,800 level as to whether this will play out. On the other hand price could break and close above this resistance level and push back towards $8,000 price range.
You are very consistent with your post, a true steemian must learn it from you, appreciate , upvoted>>>
Thank you - glad you like the post.
Thank you. Very informative!
Congratulations @famunger! You have completed the following achievement on Steemit and have been rewarded with new badge(s) :
Click on the badge to view your Board of Honor.
If you no longer want to receive notifications, reply to this comment with the word
STOPTo support your work, I also upvoted your post!
Thanks for the update and the enhancements you’ve made
Your welcome - great if you find the changes as enhancements and that they bring value to you.
Nice one.
Pls fellow traders, trade carefully. read about coinsmarkets exit scam. We have started analyzing cryptocurrency exchanges that may exit in future. keeping you alert. read here, upvote and follow us for more updates.
https://steemit.com/cryptocurrency/@coinratecap/coinsmarkets-scam-why-is-nobody-talking-about-it
I agree with TradeDevils analysis the most. NVT ratio is screaming sell and if you check historical data it has been pretty accurate.
Yes you are right - I also think he is spot on. But he is leaning bullish - I tend to be more on the bear side at the moment. But he perfectly laid out both ways.
In trading and especially in this current market awareness is the key which is why your post can serve as a good starting point for awareness on different analysis and opinions!
In trading and especially in this current market awareness is the key.