BITCOIN TA UPDATE 02.04.2018
.png)
It is pretty clear that we are still in correction mode. But before digging further into that I want to show you something that many have dismissed when we were at the start of this correction phase.
Since we had a huge extended fifth at the end of the bull run we had to use other methods than just fib levels or support zones to accurately predict where we were going to head.
In this post I just want to introduce one way of doing just that:
.png)
Whenever you see an extended fifth wave, you target the low of wave 2 of 5! Then you start to look for confluences in fib levels or other support zones.
Let's see if that applies for Bitcoin (at least for the first 5,3,5 zig zag):
.png)
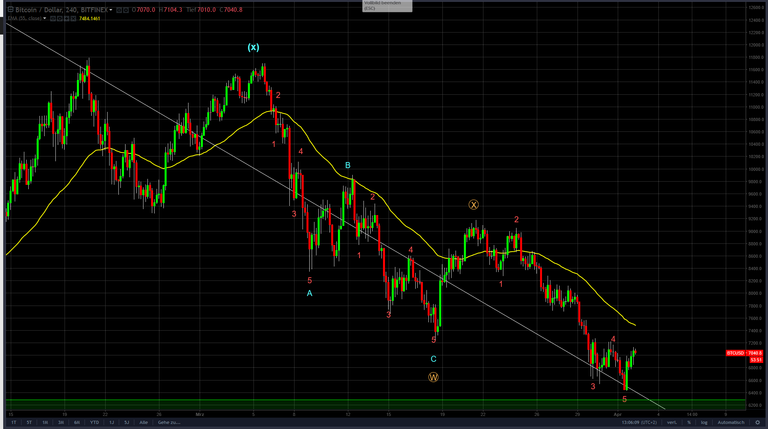
As you can see we almost perfectly hit that target with our initial abc zig zag and afterwards made an attempt for an impuls up, which most likely has failed, therefor we denote that as an X and now expect a WXY correction.
So now we ask ourselves what logical targets would be now that we can pretty much confirm that the impulse has failed. First of all, let's look at what we already have and try to get some order into that!
.png)
As you can see we already finished an abc zig zag in our Y wave. After that we tried to make an impulse, which - once again - failed. Now we have to expect something more complex for Y. To me the most likely scenario is that Y will be composed of another WXY structure! And we already finished the first 5 waves down.
.png)
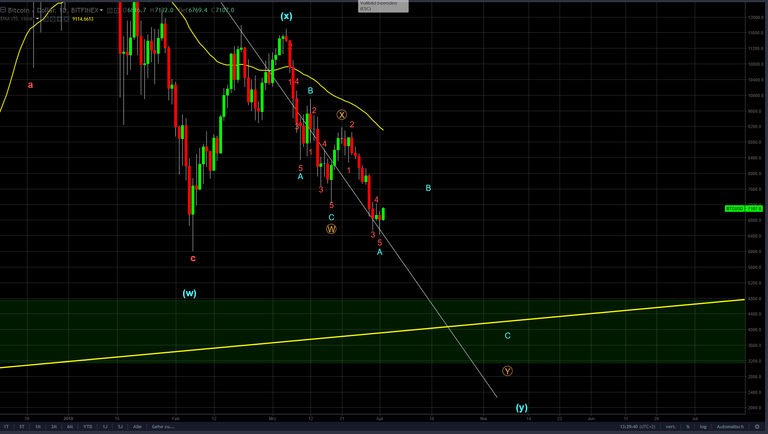
Is this it? - Probably not! We have to anticipate that this will be another abc zig zag! So these 5 waves now make an A and we might be working on B right now. Then another 5 waves down will complete the abc.
Now the only question left is where that will take us!
.png)
First, if we target a 50% retracement for B and then extrapolate a 1:1 ratio for A:C we arrive at around $5k.
That is our first tool to get an idea.
Secondly, we have the 0.786 retracement level for the whole cycle below that at around 4.4k.
.png)
Thirdly, we have our yellow long term sloped support line which we would hit at around 4.2k.
.png)
Moreover we are then in 4th wave territory, which usually offers lots of support as well!
.png)
What to expect now:
We are now left with a zone from 4k to 5k, that will most likely be where Y will be finished and we will make another attempt for an impulse. If that impulse will be successful we will head towards new all time highs. If not, we have to denote the failed impulse with another X and should anticipate a WXYXZ correction to form!
If this was helpful to you, an upvote would be very much appreciated! Thank you!
Take care!
Congratulations @dreambigdobigger! You received a personal award!
You can view your badges on your Steem Board and compare to others on the Steem Ranking
Vote for @Steemitboard as a witness to get one more award and increased upvotes!